

Opportunities Scanner
The Opportunities Scanner ranks the best opportunities on the US market for premium selling and vertical spreads, ordered by return on the capital required. Instead of opening one chain after another, you filter the whole scanned universe and open the ones worth a closer look.
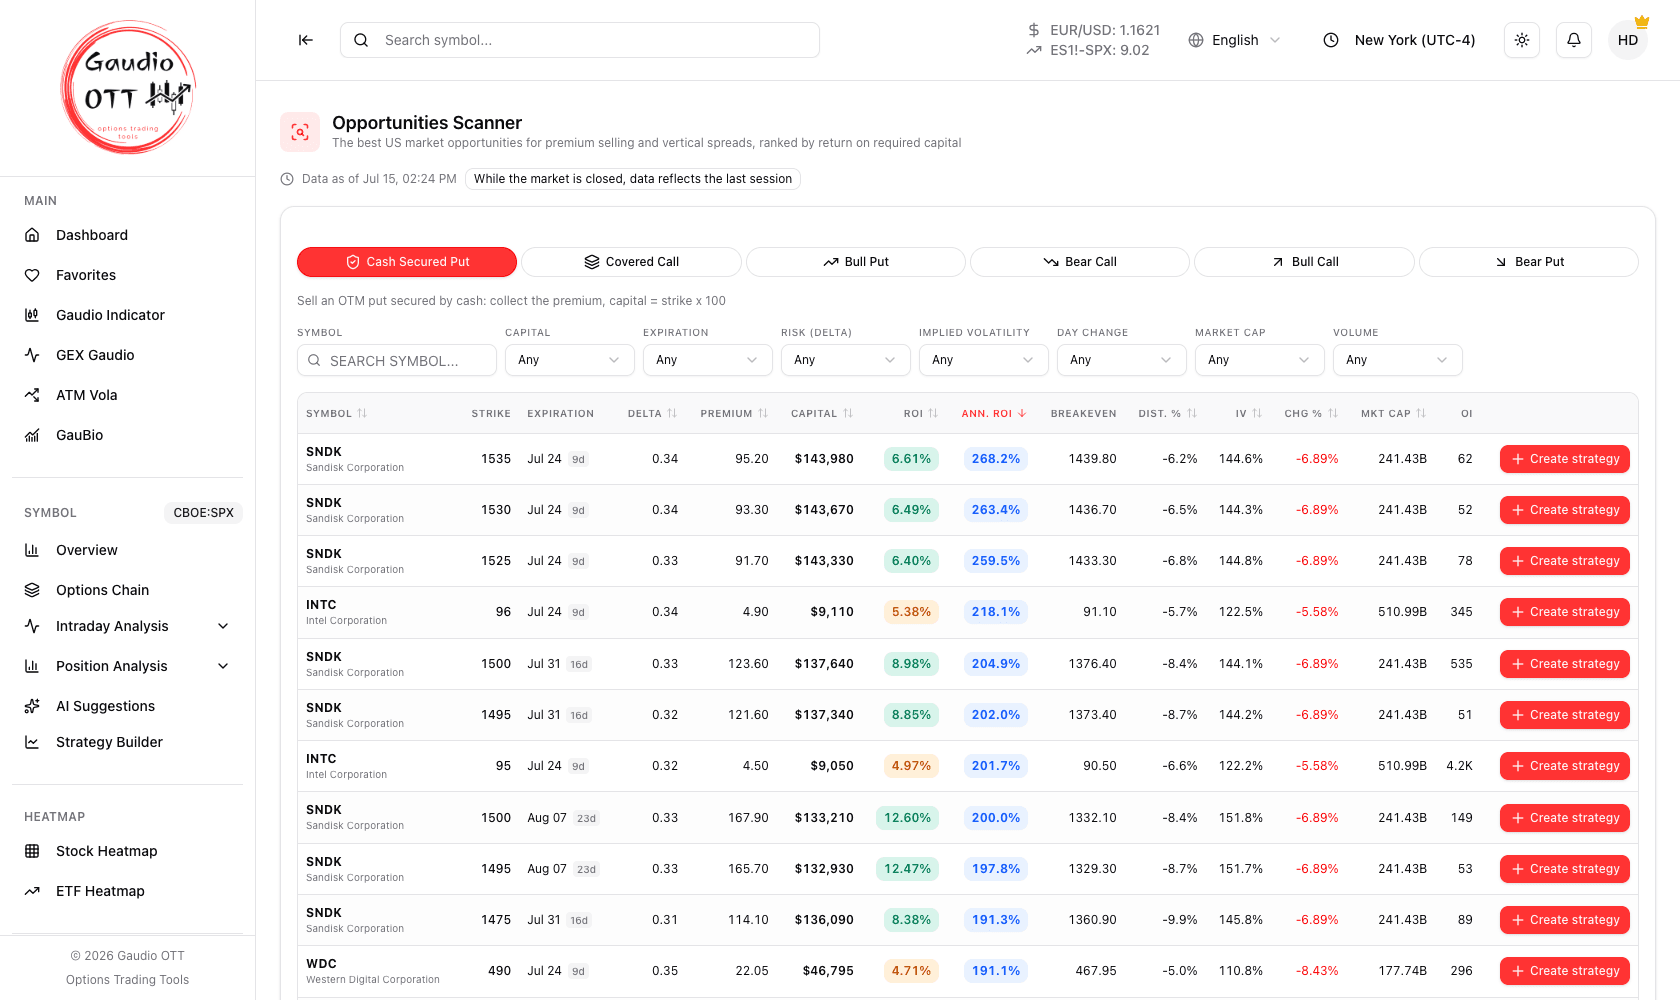
The scanner: pick a strategy, set your constraints, and read the ranking by annualised ROI. Every row can be sent straight into the Strategy Builder.
Where it is
Section titled “Where it is”Side menu, Utility → Opportunities Scanner. Available on the Strategy and Ultra plans. It is not symbol-relative: it scans a market-wide universe.
What it scans
Section titled “What it scans”The scan covers a universe of over 200 US underlyings — the most liquid stocks on NASDAQ, NYSE, AMEX and CBOE, plus a fixed set of highly liquid ETFs (SPY, QQQ, IWM, DIA, GLD, SLV, TLT, HYG, the main sector ETFs and others).
Expirations between 7 and 60 days are considered, which is the window where premium-selling structures are normally placed.
The six strategies
Section titled “The six strategies”Use the strategy selector to switch between:
| Strategy | What it is |
|---|---|
| Cash Secured Put | Sell an out-of-the-money put secured by cash: you collect the premium, and the capital required is the strike times 100 |
| Covered Call | Buy-write: buy 100 shares and sell an out-of-the-money call, giving a static return on cost |
| Bull Put | Bullish credit spread: sell an out-of-the-money put and buy a lower put for protection |
| Bear Call | Bearish credit spread: sell an out-of-the-money call and buy a higher call for protection |
| Bull Call | Bullish debit spread: buy a call and sell a higher call; ROI is max profit over the debit |
| Bear Put | Bearish debit spread: buy a put and sell a lower put; ROI is max profit over the debit |
The filters
Section titled “The filters”Every filter offers quick presets as well as free numeric entry:
- Symbol — restrict to a single underlying, matched by prefix.
- Capital — a maximum required capital, so results fit the size you actually trade.
- Market cap — a minimum capitalisation.
- Volume — a minimum underlying volume.
- Implied volatility — Low (under 20%), Medium (20–40%), High (over 40%), or a custom range.
- Day change — Up today, Down today, Strong rally (over +2%), Strong drop (under −2%), or a custom range.
- Expiration — Short (7–14 days), Medium (15–30 days), Long (31–60 days).
- Risk (delta) — Conservative (0.15–0.20), Balanced (0.20–0.30), Aggressive (0.30–0.35), based on the absolute delta of the short leg.
Clear filters resets everything at once.
Reading the results table
Section titled “Reading the results table”| Column | Meaning |
|---|---|
| Symbol | The underlying |
| Strike | Strike of the structure |
| Expiration / DTE | Expiration date and days to expiration |
| Delta | Delta of the short leg |
| Premium | Net premium of the structure |
| Capital | Capital required |
| ROI | Return over the period |
| Ann. ROI | Annualised return |
| Breakeven | Break-even price |
| Dist. % | Distance of the strike from spot, as a percentage |
| IV | Implied volatility |
| Chg % | Day change of the underlying |
| Mkt cap | Market capitalisation |
| OI | Open Interest |
The table is sorted by annualised ROI descending by default, and every column can be used as the sort key. Results are paginated 25 at a time.
From a result to a strategy
Section titled “From a result to a strategy”Each row has a Create strategy action. It opens the Strategy Builder on that underlying with the legs already prefilled — strikes, expiration and quantities — so you can adjust it, simulate it and save it without re-entering anything.
The first scan
Section titled “The first scan”The first time the scanner is opened on a fresh installation of the data, it has to analyse the option chains of the whole universe. The page shows a progress panel with the number of symbols processed and an estimated time remaining. This happens once: results are then shared between users and refreshed automatically.
The banner above the table always states the time the data refers to, and warns you when a refresh is in progress. When a newer scan completes while you are on the page, the table reloads by itself and tells you the data has been updated. While the market is closed, the data reflects the last session.
Why traders use it
Section titled “Why traders use it”Premium selling is a numbers game across many underlyings, and reading chains one at a time cannot cover the universe in a session. The scanner inverts the workflow: you state your constraints — capital, delta, expiration window, minimum liquidity — and let the ranking surface the handful of structures that satisfy them today. The Ann. ROI column makes structures with different durations directly comparable, which is what makes the ranking meaningful.
Common mistakes
Section titled “Common mistakes”- Ranking on ROI alone. Check Dist. %, Delta and OI too: the highest annualised return usually carries the highest assignment risk and sometimes the thinnest liquidity.
- Ignoring the data timestamp. The scan is periodic, not tick-by-tick; verify the price on the chain before acting.
- Filtering by capital after picking a row. Set the capital filter first, or you will shortlist structures you cannot size.
- Treating a result as a recommendation. The scanner ranks by a stated metric; it does not assess whether the underlying is one you want exposure to.
Frequently asked questions
What is the Opportunities Scanner in Gaudio OTT?
It is a market-wide screener that ranks the best US opportunities for premium selling and vertical spreads by return on the capital required. It scans over 200 liquid US underlyings on expirations between 7 and 60 days, across six strategy types, and lets you filter by capital, market cap, volume, implied volatility, day change, expiration window and short-leg delta.
Which strategies does the Opportunities Scanner support?
Six: Cash Secured Put, Covered Call, Bull Put, Bear Call, Bull Call and Bear Put. The first four are credit structures and the last two are debit spreads, where ROI is max profit over the debit.
Which plans include the Opportunities Scanner?
Strategy and Ultra. It is not available on the Free or Premium plans.
How up to date is the scanner data?
The scan runs periodically and its results are shared between users. The banner above the table always states the time the data refers to and warns when a refresh is running; when a newer scan completes the table reloads by itself. While the market is closed the data reflects the last session, so verify prices on the chain before acting.
Can I turn a scanner result into a strategy?
Yes. The Create strategy action on each row opens the Strategy Builder on that underlying with the legs already prefilled — strikes, expiration and quantities — ready to adjust, simulate and save.
Why is the scanner showing a first scan in progress?
Because the option chains of the whole universe of over 200 underlyings are being analysed for the first time. It takes a few minutes and happens once: results are then shared and refreshed automatically.
What does the annualised ROI column mean?
It is the return on required capital rescaled to a yearly basis, which is what makes structures with different days to expiration directly comparable. It is the default sort key, in descending order.
Related pages
Section titled “Related pages”Ready to use Gaudio OTT?
Section titled “Ready to use Gaudio OTT?”Open your free account and put what you just read into practice.