

ATM Vola
ATM Vola shows the intraday behaviour of at-the-money implied volatility — the volatility of the options whose strike is closest to the current price — split by expiration type. It is the right tool for understanding, during the session, whether the market is pricing more or less movement over different horizons.
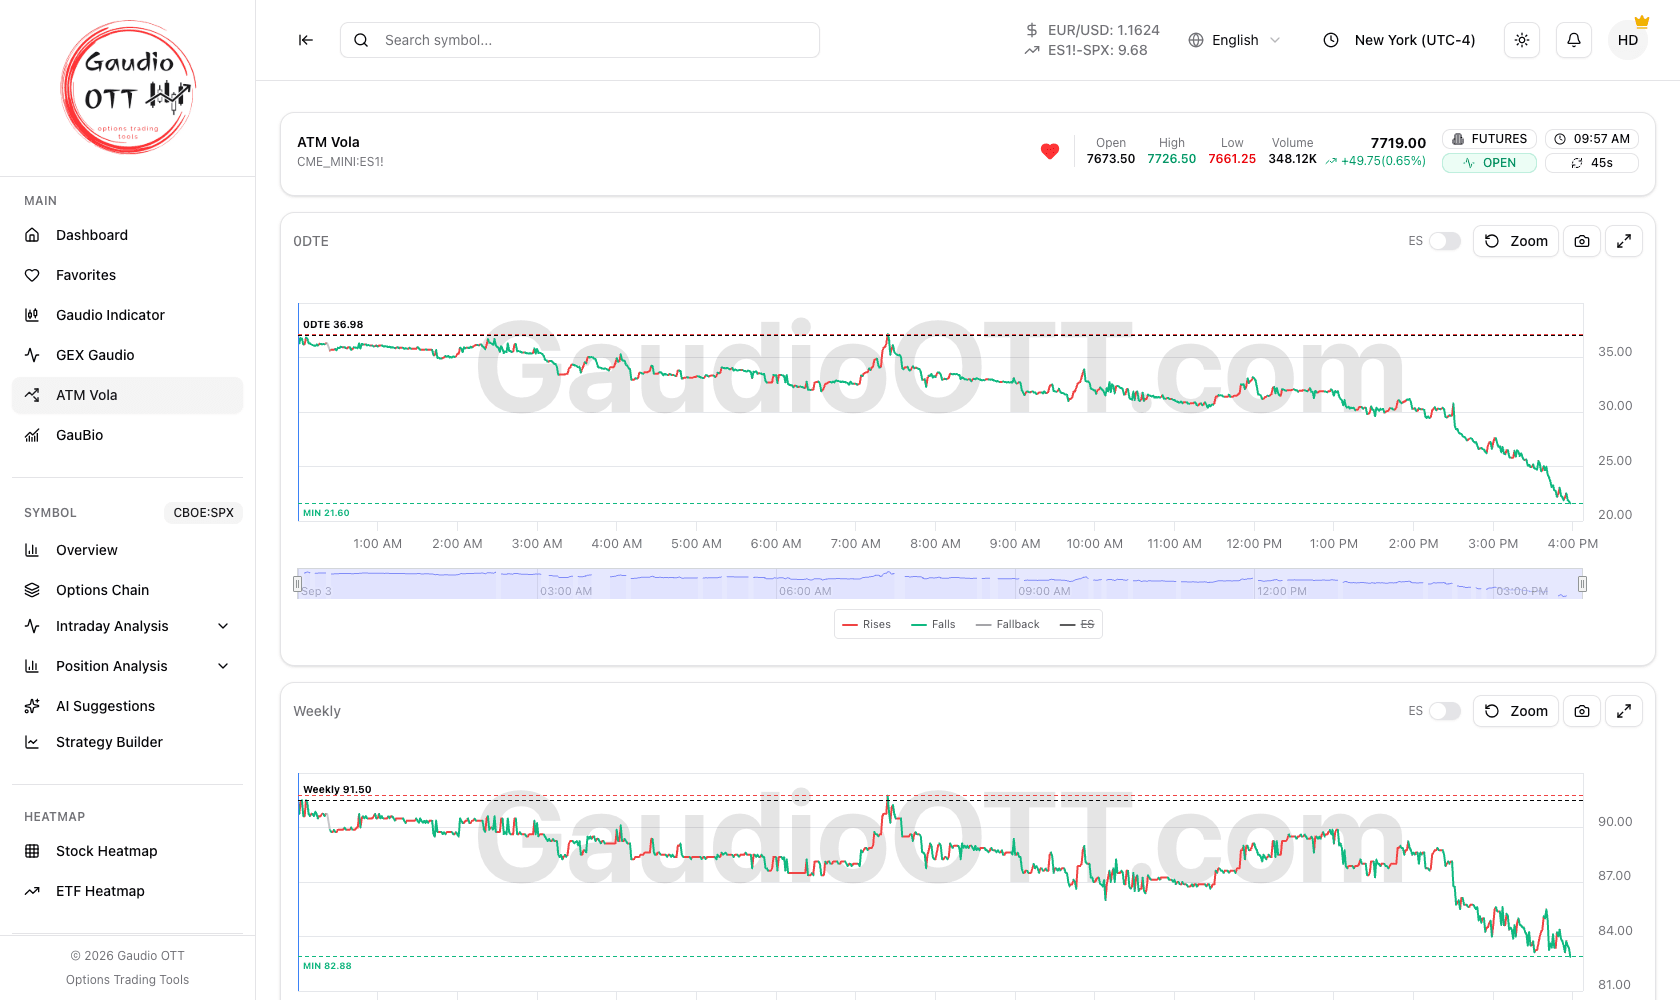
ATM Vola: one candlestick panel per expiration horizon, each with its current value and its own toolbar.
Where it is
Section titled “Where it is”Side menu, Main → ATM Vola. Available on the Premium and Ultra plans.
The three expirations
Section titled “The three expirations”The page is divided into three independent charts, one per time horizon:
- 0DTE — ATM volatility of the options expiring today. It is the most reactive and the most nervous, because it responds to every move of the underlying as expiration approaches.
- Weekly — ATM volatility on the weekly expiration: more stable than 0DTE but still sensitive to the week’s events.
- Monthly — ATM volatility on the monthly expiration, the most “background” of the three: useful for framing the overall volatility regime.
Next to each panel title the current volatility value for that expiration is shown.
How to read the chart
Section titled “How to read the chart”Each panel is a candlestick chart describing how ATM volatility moved through the session. The colours make the direction immediately readable:
- Rises — the candle indicates an increase in volatility: the market expects more movement, more uncertainty.
- Falls — the candle indicates a decrease in volatility: a calmer market.
- Fallback — marks the points where the value was reconstructed from a backup source, because the primary automatic reading was not available. These are still useful data points, but treat them as indicative.
The controls on each panel
Section titled “The controls on each panel”At the top right of every chart you find the same tools:
- Toggle ES underlying — overlays the behaviour of the underlying (ES) on the chart, so you can compare price moves with volatility moves at a glance.
- Reset Zoom — brings the chart back to the full interval after zooming.
- Screenshot — saves an image of the chart exactly as it is at that moment.
- Fullscreen — opens the panel full screen.
To read the last few hours more closely, use the mouse wheel over the chart: it zooms the time. Then drag it with the left button held down to move around. On a trackpad, a horizontal two-finger swipe moves the time, while a vertical swipe and the pinch zoom; on touch devices, pinch to zoom and move with two fingers. The vertical scale follows the part of the chart you are looking at by itself.
Automatic recording
Section titled “Automatic recording”ATM Vola data is recorded and saved automatically at regular intervals during the session, with no action from you: reopening the page brings back the day’s history already reconstructed for all three expirations.
If the market is closed or the data for today is not available yet, a yellow banner states that the page is showing the last available session, with its date.
How to use it
Section titled “How to use it”Compare the three expirations against each other:
- when 0DTE rises much more than weekly and monthly, the market is pricing very short-term tension;
- when weekly and monthly rise too, the increase in uncertainty is more structural.
Turning on the ES underlying overlay helps you see whether the volatility spikes coincide with the price moves, or whether volatility is moving on its own — which is usually the more interesting case.
Common mistakes
Section titled “Common mistakes”- Comparing the absolute levels of the three panels. Different horizons carry structurally different volatility levels; what matters is the direction and the relative change.
- Treating fallback points as precise. They are reconstructed values, useful for shape and trend but not for exact readings.
- Expecting other symbols. ATM Vola is built on the S&P 500 complex, with ES as the overlay underlying.
Frequently asked questions
What does ATM Vola show in Gaudio OTT?
The intraday behaviour of at-the-money implied volatility, that is the volatility of the options whose strike is closest to the current price, split into three independent charts for the 0DTE, weekly and monthly expirations.
What is the difference between the 0DTE, weekly and monthly panels?
0DTE covers options expiring today and is the most reactive, because it responds to every move of the underlying as expiration approaches. Weekly is more stable but still sensitive to the week events. Monthly is the most background of the three and is used to frame the overall volatility regime.
What does the Fallback marker on an ATM Vola chart mean?
It marks a point where the value was reconstructed from a backup source, because the primary automatic reading was not available at that moment. The data is still useful for reading shape and trend, but should be treated as indicative rather than exact.
What does the ES underlying toggle do?
It overlays the behaviour of the ES underlying on the volatility chart, so you can see at a glance whether volatility spikes coincide with price moves or whether volatility is moving independently.
Do I need to be at the screen for ATM Vola to record data?
No. The data is recorded and saved automatically at regular intervals during the session. Reopening the page brings back the whole day already reconstructed for all three expirations.
Which plans include ATM Vola?
Premium and Ultra.
Related pages
Section titled “Related pages”Ready to use Gaudio OTT?
Section titled “Ready to use Gaudio OTT?”Open your free account and put what you just read into practice.