Options Chain
The Options Chain shows every call and put available on an instrument for the expiration you choose, with prices and greeks. It is the tool for studying one expiration in detail before building a strategy.
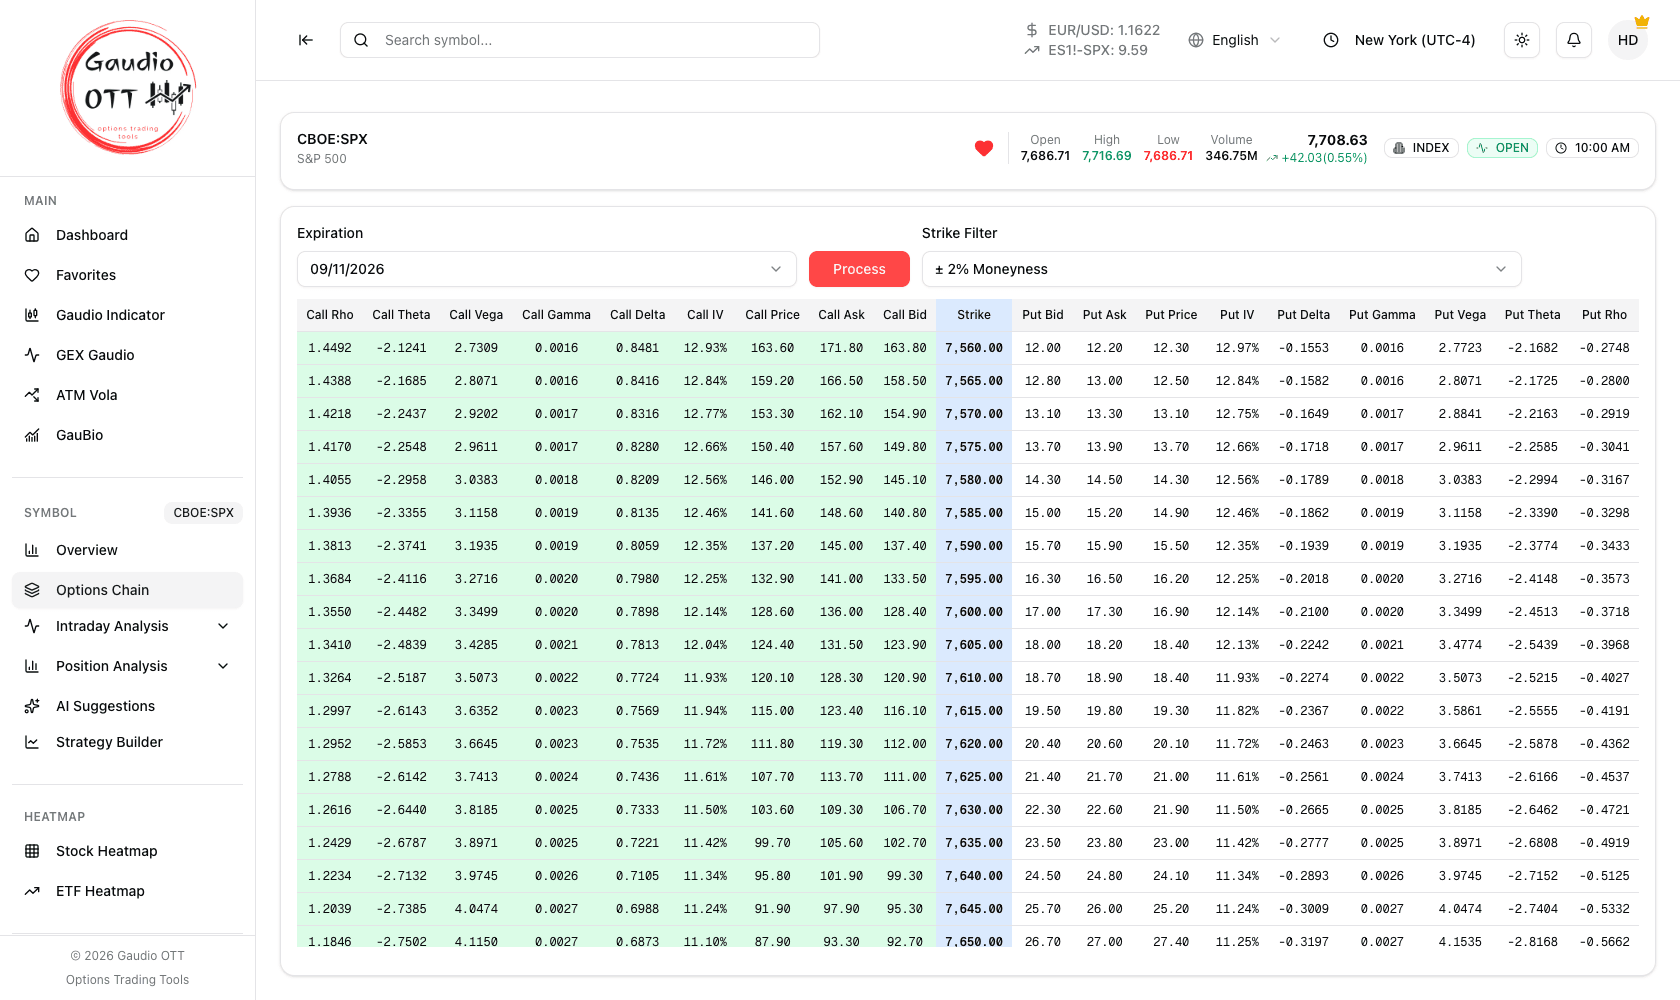
The chain after pressing Process: calls on the left, puts on the right, in-the-money rows shaded.
What this page shows
Section titled “What this page shows”For each strike of the selected expiration, the table gives the same set of values on the call side and the put side:
| Column | Meaning |
|---|---|
| Bid | Best bid |
| Ask | Best ask |
| Price | Theoretical price of the contract |
| IV | Implied volatility, as a percentage |
| Delta | Sensitivity to a move in the underlying |
| Gamma | Rate of change of delta |
| Vega | Sensitivity to a change in implied volatility |
| Theta | Time decay |
| Rho | Sensitivity to interest rates |
The Strike column sits in the middle, and in-the-money cells are shaded so you can see the money boundary without reading numbers.
Volume and Open Interest are not columns of this table: they belong to the dedicated analyses — intraday Open Interest, intraday volumes and the position studies.
Above the table
Section titled “Above the table”The page opens with a summary of the active symbol — name, open, high, low, volume, price and change, type and market status — and the heart for your favorites.
Below the controls, the Intraday row links to the intraday analyses on the same symbol: Volatility, Open Interest, Volumes and GEX Volumes. They belong to Premium and Ultra: on the other plans each link carries a small lock, and the page it opens says which plan it needs. The options chain itself is available on every plan, Free included.
Selecting the expiration
Section titled “Selecting the expiration”From the Expiration dropdown, which lists every date with its weekday and the days left until it expires, choose the one you are interested in, then press the red Process button. The table loads only after this step, so you fetch exactly the expiration you want to analyse rather than every series at once.
The page remembers your choice. The last expiration you processed on a symbol, and its strike filter, are saved on your account: the next time you open that symbol’s chain they are loaded again on their own, and you press Process only to change expiration. Picking a date from the Options card of the symbol overview opens the chain already processed on that date.
On futures, options belong to a specific contract month, so every entry of the Expiration list also names its underlying contract — for example 10/12/2026 - CME_MINI:ESZ2026 — and the name of the options product. Once you press Process, the price of that contract is shown above the table.
Filtering the strikes
Section titled “Filtering the strikes”Once the chain is loaded, the Strike Filter narrows the view to the strikes that matter. Presets go from ± 1% to ± 50% around the current price (it opens on ± 2% Moneyness), plus All and a Custom min to max range. Pick one and press Apply: the table changes only then. If the filter is tighter than the listed strikes, the table tells you no strikes fall in range instead of showing an empty grid.
European instruments: end-of-day Eurex chains
Section titled “European instruments: end-of-day Eurex chains”For pan-European equity and index options settled on Eurex, the chain is built from Eurex end-of-day settlement data. A badge marked EOD - Eurex appears above the table, stating the settlement date and the currency, and:
- bid and ask are shown as
-— there is no intraday quote in this data; - the Price column carries the settlement-based theoretical price;
- when the contract is American-style, the badge notes that the implied volatility is indicative, because it is derived with a European model.
US options chains are unaffected: they have real-time bid, ask and greeks.
Why traders use it
Section titled “Why traders use it”The chain is where an idea becomes concrete. Reading bid/ask against the theoretical Price tells you what the spread will cost you to enter; IV across neighbouring strikes shows whether the strike you like is expensive relative to its neighbours; Delta and Theta turn a directional view into a position size and a time budget. It is also the fastest way to check that an expiration is actually tradeable before you plan around it.
How to use it inside Gaudio OTT
Section titled “How to use it inside Gaudio OTT”Use the chain to study one expiration, then move to the Strategy Builder, where you can build and simulate multi-leg strategies from the same strikes — the builder shows the chain alongside the payoff chart, so you can click a strike straight into a leg.
Common mistakes
Section titled “Common mistakes”- Forgetting to press Process. The first time you open a symbol’s chain nothing loads until you do; an empty page after picking a date usually means this.
- Looking for volume or Open Interest here. They live in the intraday and position analyses.
- Reading Eurex bid/ask as missing data. The dashes are expected: that chain is settlement-based by design.
- Judging a strike by premium alone. A high premium is only interesting once volatility, positioning and distance from spot agree with your thesis.
- Analysing one side only. Comparing the call and put side of the same strike is usually more informative than either alone.
Frequently asked questions
What does the Gaudio OTT options chain show?
For the selected expiration it shows every strike with, on both the call and put side, bid, ask, theoretical price, implied volatility, delta, gamma, vega, theta and rho. In-the-money cells are shaded and the strike column sits in the middle of the table.
Why is the options chain table empty?
Most likely because the expiration has been selected but the Process button has not been pressed yet. The table loads only after Process. If it still shows nothing, check that the strike filter is not narrower than the listed strikes, and that the instrument actually has listed options.
Does the options chain show volume and Open Interest?
No. Volume and Open Interest have their own dedicated analyses: the intraday Open Interest and volume charts, and the position Open Interest and volume studies.
Why do European options have no bid and ask?
Because pan-European equity and index options are sourced from Eurex end-of-day settlement data, which contains no intraday quotes. Those chains carry an EOD - Eurex badge with the settlement date and show a theoretical price instead of bid and ask.
How do I limit the chain to the strikes near the price?
Use the Strike Filter next to the Process button. Presets range from ± 1% to ± 50% around the current price, and there is also an All option and a custom minimum-to-maximum range.
Which plans include the options chain?
All of them, including Free. The options chain is part of the Symbols feature group available on every plan.
Related pages
Section titled “Related pages”Ready to use Gaudio OTT?
Section titled “Ready to use Gaudio OTT?”Open your free account and put what you just read into practice.