Intraday Open Interest chart
The Intraday Open Interest chart shows, strike by strike, the Open Interest of the options on the active symbol — that is, the number of open contracts — separating calls from puts. It is the tool for locating the price levels where market interest is most concentrated.
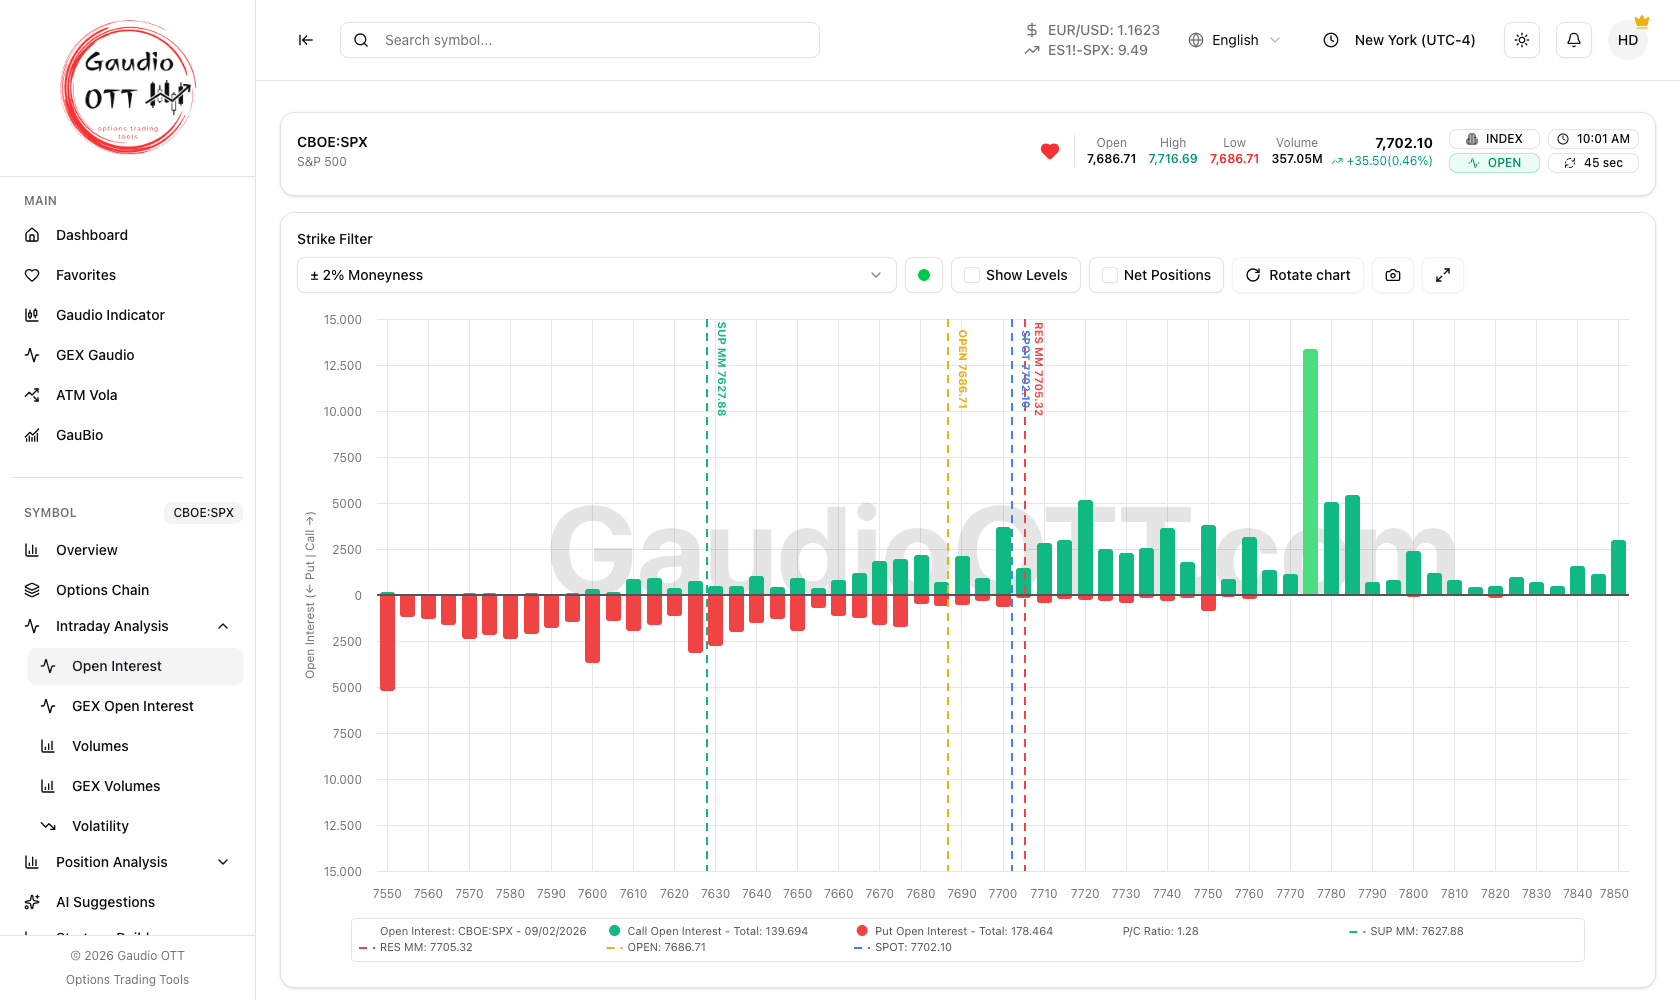
Open Interest by strike: calls in green, puts in red, with the Strike Filter, Show Levels and Net Positions in the toolbar.
Where it is
Section titled “Where it is”Side menu, Symbol → Intraday Analysis → Open Interest. It refers to the active symbol. Available on the Premium and Ultra plans; it also works on futures, within the limits described in On futures.
How to read it
Section titled “How to read it”- The chart shows one expiration: the nearest, today’s when there is one (0DTE). It cannot be changed on this page; the date is in the legend and on the Expiration card.
- Each bar is a strike, and its height is the Open Interest on that strike. Calls rise above the zero line in green, puts go below it in red; the bar of each side’s largest strike is drawn in a lighter shade.
- The blue dashed SPOT line marks the current price, so you can judge which concentrations sit above and which below the market.
- The legend gives the Call Open Interest and Put Open Interest totals of the whole expiration, which the Strike Filter does not change, and the P/C Ratio. Clicking a legend item hides or shows that series or line.
- The cards under the chart give Spot Price, Last Update, Expiration, Support MM, Resistance MM, Max Call Strike, Max Call Open Interest, Max Put Strike and Max Put Open Interest.
- The data reloads every 60 seconds: the countdown is in the header, and Last Update says when it last arrived. It pauses while the browser tab is hidden.
Controls
Section titled “Controls”- Strike Filter — starts at ± 2% Moneyness. The menu offers All, Custom min to max (two strike prices), and ± 1%, ± 2%, ± 5%, ± 10%, ± 20%, ± 30% and ± 50% Moneyness; confirm with Apply.
- Show Levels — off by default. It draws the market maker support (SUP MM, green) and resistance (RES MM, red) while the market is open or in pre-market, and the session OPEN (yellow) while it is open; with the market closed it draws nothing. When a level sits outside the filtered strikes, the chart widens to include it.
- Net Positions — on each strike keeps only the larger side, by the difference between calls and puts. The legend totals stay gross.
- Rotate chart — the bars start vertical on a computer and horizontal on a phone; Rotate chart switches between the two.
- Zoom with the mouse wheel, or by pinching, on the strikes; Reset Zoom appears while the chart is zoomed.
- The camera icon (Save chart) downloads the chart as an image, the expand icon (Full screen) opens it full screen.
The page remembers, for each symbol, the Strike Filter, Show Levels, Net Positions and the lines you hid from the legend. Rotation and zoom start over at every visit.
Why traders use it
Section titled “Why traders use it”Strikes with high Open Interest tend to act as reference areas: they are the levels where the market holds the largest number of open positions, and where dealer hedging concentrates. Comparing them with the current price is how you locate candidate support and resistance zones that come from positioning rather than from chart geometry.
The Put/Call ratio of Open Interest adds context to that read: a heavy put concentration below the market means something different from a symmetrical profile, even when the largest single bar is the same.
Open Interest or volumes?
Section titled “Open Interest or volumes?”The two charts complete each other:
- Open Interest shows where positions are already open — the accumulated state.
- Volumes show where trading is happening now — today’s flow.
A sudden concentration of volume on a strike often precedes a change in Open Interest over the following days.
On futures
Section titled “On futures”It also works on futures with listed options, such as ES and NQ, with two differences from stocks and indices:
- Volume and open interest are only available for strikes near the price, about ±3% on ES. The header says so with the Vol/OI only within ±X% notice, which gives the covered band: a wider strike filter adds no data.
- Show Levels on ES and NQ draws the day’s market maker supports and resistances from the Gaudio Indicator, while the market is open or in pre-market. Other futures have no market maker levels: Show Levels draws only the OPEN line.
European symbols
Section titled “European symbols”Symbols whose options trade on Eurex or IDEM, such as European and Italian stocks, the DAX and the FTSE MIB, work on end-of-day data: the chart shows the open interest of the nearest expiration as of the last settlement, and the header reads Eurex end-of-day open interest as of (or IDEM) followed by the date. Refreshing the page does not change the bars until the next settlement is published. The other intraday pages show the End of Day data card for these symbols.
Common mistakes
Section titled “Common mistakes”- Reading Open Interest as direction. It says how many contracts are open, not who is long or short.
- Trusting a single large bar on an illiquid name. These profiles are meaningful on liquid instruments; on thin chains one print distorts the picture.
- Filtering too tightly. A ± 1% filter can hide the concentration that actually matters, which is often further out.
- Widening the strike filter on a futures contract and expecting more bars. Volume and open interest only arrive within the band the header notice gives: past it, the chart does not change.
Frequently asked questions
What does the intraday Open Interest chart show in Gaudio OTT?
The number of open call and put contracts for each strike of the active symbol, plotted as bars with calls and puts in different colours, a dashed line at the current price, and a legend with the call and put totals and the Put/Call ratio.
What is the difference between Open Interest and volume?
Open Interest is the number of contracts currently open, so it describes accumulated positioning. Volume is the number of contracts traded during the session, so it describes activity happening now. A volume spike on a strike often precedes a change in its Open Interest over the following days.
Which plans include the intraday Open Interest chart?
Premium and Ultra. The chart is part of the Intraday feature group, which is not available on the Free or Strategy plans.
Does the intraday Open Interest chart work on futures?
Yes, on futures with listed options such as ES and NQ. Volume and open interest are only available for strikes near the price, though, about ±3% on ES, and the header notice gives the covered band.
What does the Net Positions option do?
It replaces the two separate call and put series with their net balance per strike, which makes the direction of the imbalance easier to read than comparing two bars.
Can high Open Interest strikes act as support and resistance?
They are commonly used that way. Strikes with the largest number of open contracts are the levels where positioning and dealer hedging concentrate, so price often reacts around them. They are reference areas to watch, not signals to trade on their own.
Related pages
Section titled “Related pages”Ready to use Gaudio OTT?
Section titled “Ready to use Gaudio OTT?”Open your free account and put what you just read into practice.