

Payoff chart and simulation
The payoff chart — labelled Profit & Loss Chart in the app — is the interactive risk and reward profile of the strategy. On its own it shows what the position is worth at expiration; with the simulation enabled it also shows what it is worth now, and what it would be worth under a different price, date or volatility.
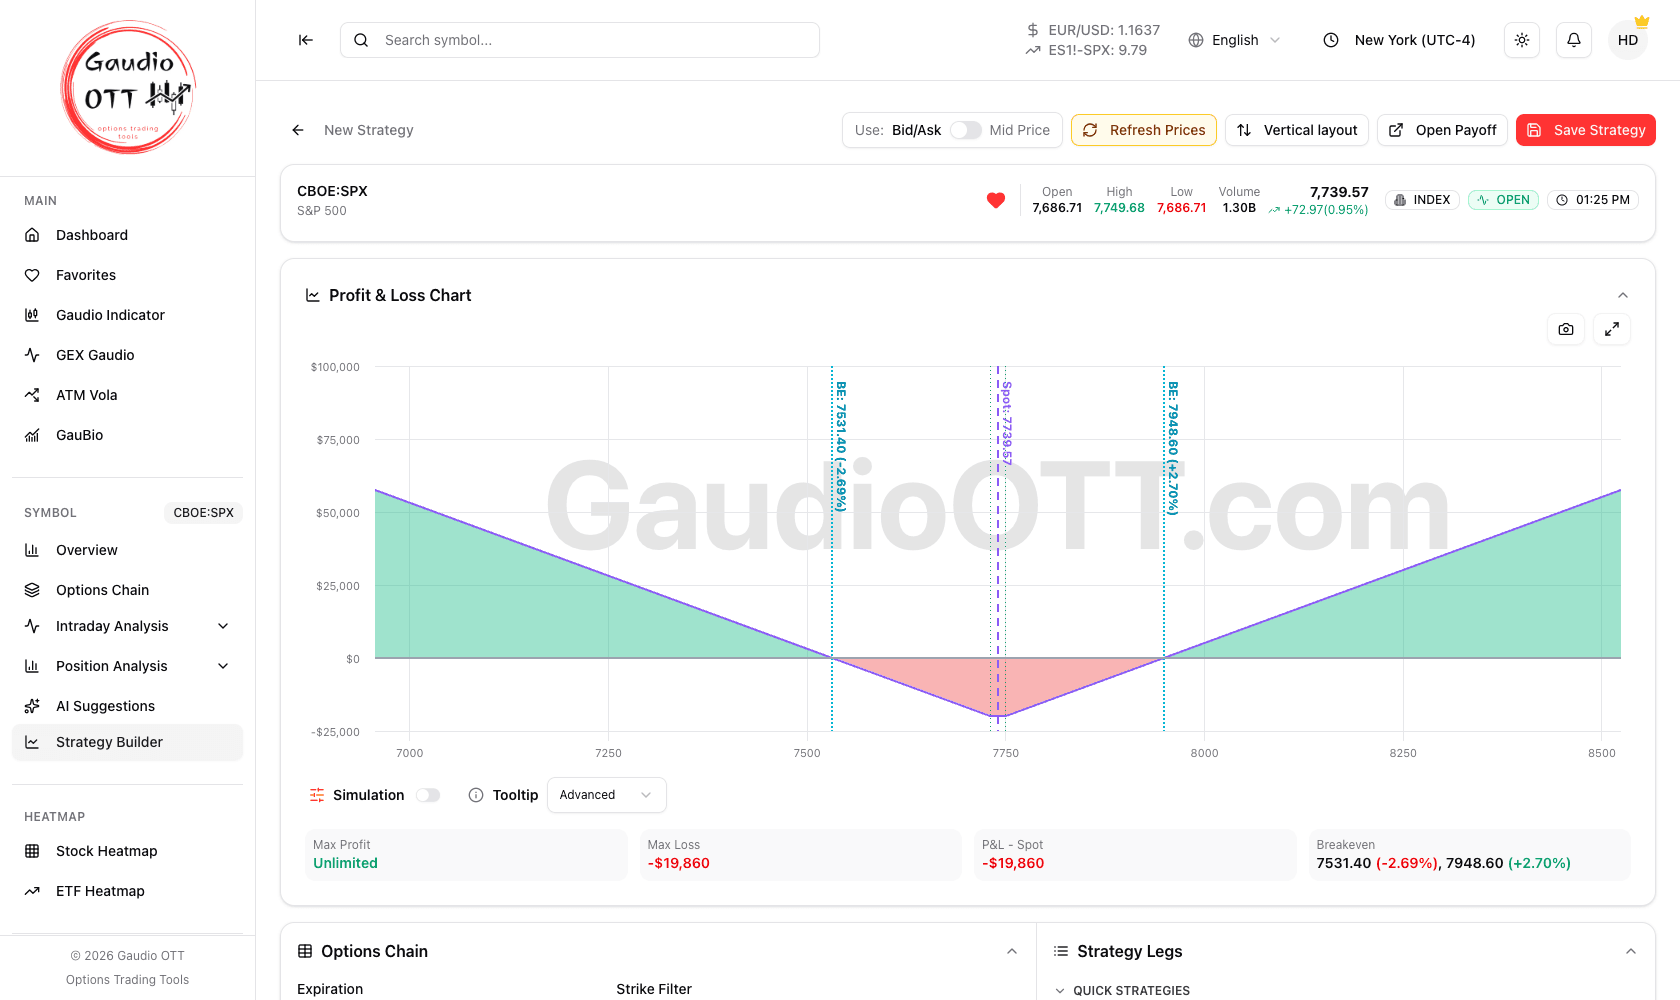
The payoff at expiration: profit shaded green, loss red, with the two breakeven lines and the spot line labelled with their values.
Lines and markers on the chart
Section titled “Lines and markers on the chart”| Indicator | Description |
|---|---|
| At Expiry line | The classic profit and loss profile at expiration |
| At Now line | Current profit and loss, visible with simulation active |
| Breakeven lines | The break-even points, which move during simulation |
| Spot line | The current position of the underlying price |
| Green dashed lines | Strikes of the bought options still open |
| Red dashed lines | Strikes of the sold options still open |
Under the chart, four summary values: Max Profit (which reads Unlimited where the profile has no cap), Max Loss, P&L - Spot — the profit and loss at the current underlying price — and Breakeven, listing every break-even level with its distance from spot as a percentage. On a saved strategy, Realized P&L and the expiration are shown alongside them.
The strike lines cover the still open legs only: a closed leg no longer weighs on the curve, so its strike is no longer marked. Expired legs keep their line until you confirm how they ended.
The breakeven and spot lines are labelled directly on the chart with their value and their distance from spot, so the levels can be read without hovering.
Interactive tooltip
Section titled “Interactive tooltip”Hovering over the chart shows a tooltip with, in real time:
- P&L at expiry at the selected point;
- P&L At Now (when simulation is active);
- detailed P&L for each individual leg;
- the price and its distance from spot.
The per-leg breakdown is the useful part: it tells you which leg is carrying the position and which one is dragging on it at that price.
Controls
Section titled “Controls”- Zoom and pan — use the mouse wheel to zoom in and out, and drag the chart with the left button held down to move along the prices. On a trackpad, a horizontal two-finger swipe moves the prices, while a vertical swipe and the pinch zoom; on touch devices, pinch to zoom and move with two fingers.
- Reset zoom — a dedicated button, once you have zoomed.
- Save chart — save an image of the chart.
- Fullscreen — view the chart full screen.
- Tooltip — a Basic / Advanced selector controlling how much detail the hover tooltip shows. Advanced is what adds the per-leg breakdown.
- Clear all — in the legs panel, removes every leg entered.
Simulation
Section titled “Simulation”Simulation is enabled with the Simulation switch under the chart, available both in view mode and in creation and editing mode.
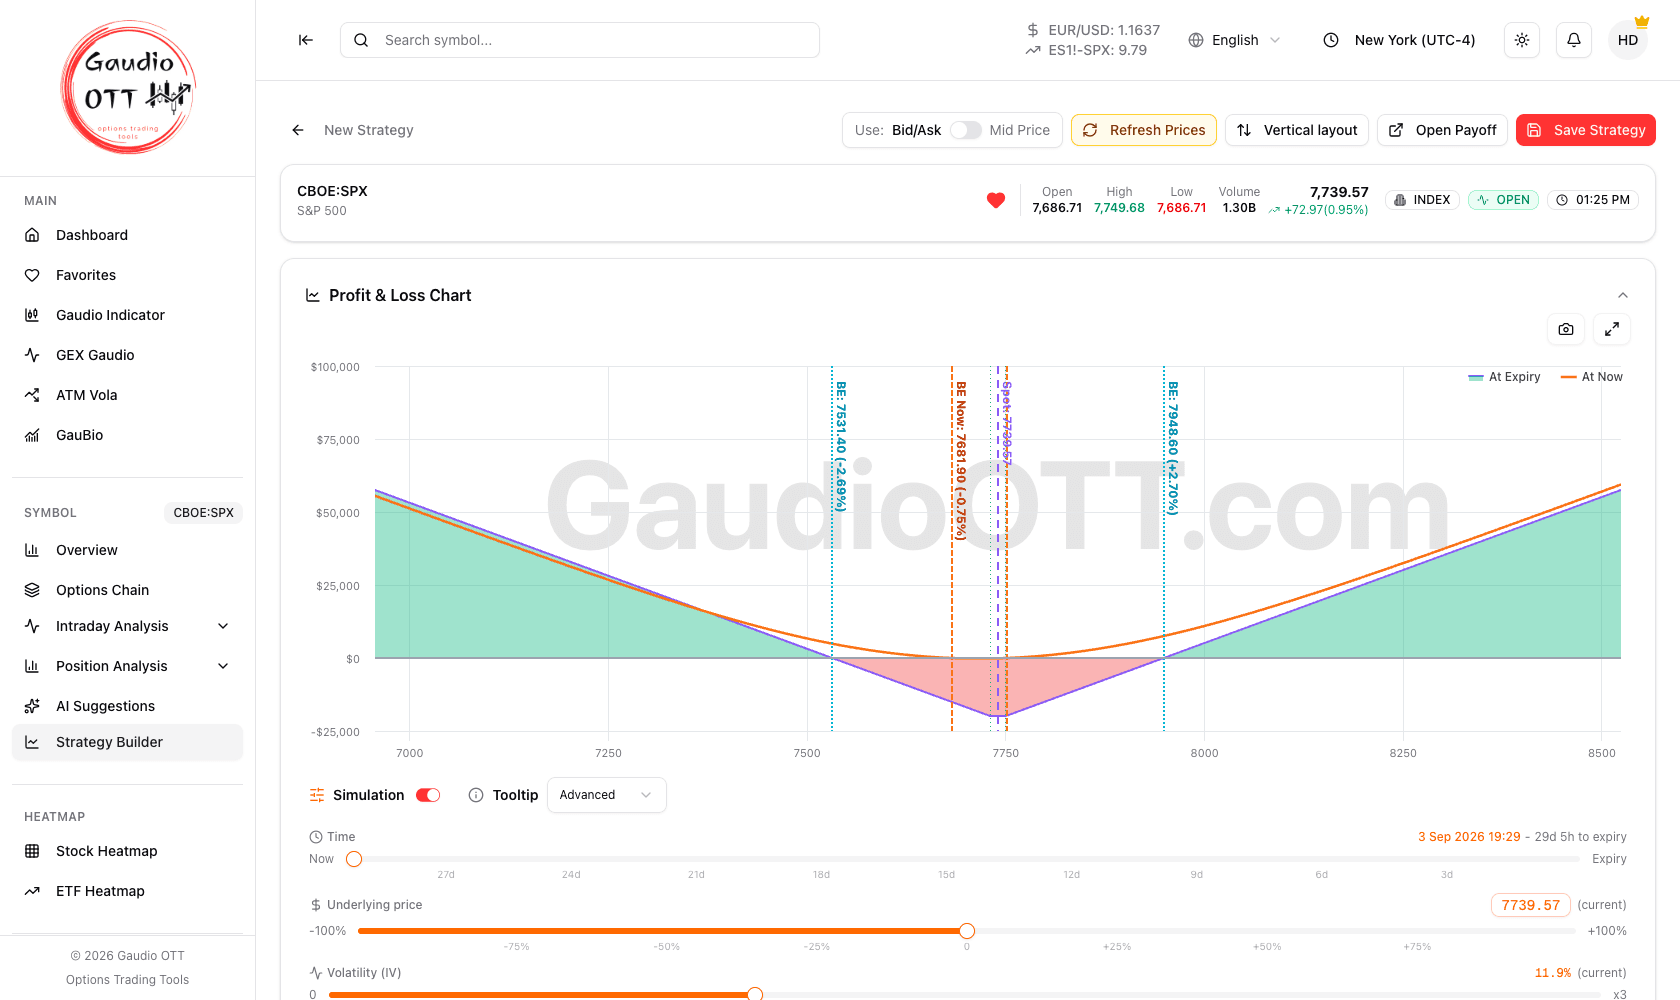
With simulation on: the orange At Now line, its own moving breakeven, and the Time, Underlying price and Volatility sliders.
What it shows
Section titled “What it shows”Turning on simulation adds the At Now line to the chart, in orange: the profit and loss profile of the strategy at this moment, taking into account the remaining time and current volatility. That is the line that tells you what closing the position today would actually mean, as opposed to holding it to expiration. A legend appears with At Expiry and At Now, and a separate BE Now line marks where the position currently breaks even.
Adjustable parameters
Section titled “Adjustable parameters”| Parameter | What it does |
|---|---|
| Time | A slider that simulates the passing of days until expiration, from Now to Expiry, with the expiration date and the time remaining shown above it. The moving breakevens update accordingly. |
| Underlying price | Simulate moves in the underlying, as a percentage either side of the current price, which is marked (current). |
| Volatility (IV) | Simulate changes in implied volatility, as a multiplier from zero up to three times the current level, which is marked (current). |
Each parameter can be returned to its live value, and the current value is always labelled so you can see how far you have moved from reality.
A worked example
Section titled “A worked example”On an Iron Condor:
- if price stays centred and time passes → the strategy moves into profit;
- if volatility falls → it moves into profit faster;
- if volatility rises → it will take more time to reach the same result.
Running those three moves on the slider before entering is the quickest way to find out whether the structure survives the scenario you are actually worried about.
Common mistakes
Section titled “Common mistakes”- Judging an open position by the At Expiry line. With weeks to go, the At Now line is the one that describes reality.
- Simulating volatility without resetting price. Two parameters moved at once make the result hard to attribute; move one, read it, reset it.
- Reading Max Loss as the worst case on a futures underlying. Check the leg types: a futures leg is valued at the contract point value, not the options multiplier.
- Forgetting the simulation is still on. The At Now line and the shifted breakevens reflect the simulated state, not the market.
- Expecting the per-leg tooltip on Basic. Switch the Tooltip selector to Advanced to get the leg-by-leg breakdown.
Frequently asked questions
What is the At Now line on the Gaudio OTT payoff chart?
It is the profit and loss profile of the strategy at the present moment, taking into account the remaining time to expiration and current implied volatility. It appears when the Simulation checkbox is enabled and is the line to read when judging an open position, as opposed to the At Expiry line.
What can I simulate on a strategy?
Three parameters: time, with a slider running from Now to Expiry that also shows the expiration date and time remaining; the underlying price, as a percentage either side of the current level; and implied volatility, as a multiplier from zero to three times the current level. The live value of each is labelled as current.
What do the green and red dashed lines mean on the payoff chart?
Green dashed lines mark the strikes of bought options, red dashed lines the strikes of sold options; they are drawn for the still open legs only, so a closed leg no longer leaves its line on the chart. The solid Spot line marks the current price of the underlying.
Why do the breakeven points move during simulation?
Because break-even depends on the time remaining and on implied volatility, not only on the strikes. As you move the time or volatility slider, the break-even levels of the position shift accordingly.
Can I see the profit and loss of each individual leg?
Yes, with the Tooltip selector set to Advanced. Hovering over the chart then shows the profit and loss at expiry, the At Now value when simulation is active, and a breakdown for each individual leg at that price. The Basic mode shows the totals only.
How often does the payoff chart update on a saved strategy?
Every minute, together with the rest of the view page. Reload the page if you want an immediate update.
Related pages
Section titled “Related pages”Ready to use Gaudio OTT?
Section titled “Ready to use Gaudio OTT?”Open your free account and put what you just read into practice.