Symbol overview
The Overview is the summary sheet of every instrument: the starting point for framing a symbol at a glance before moving to deeper analysis.
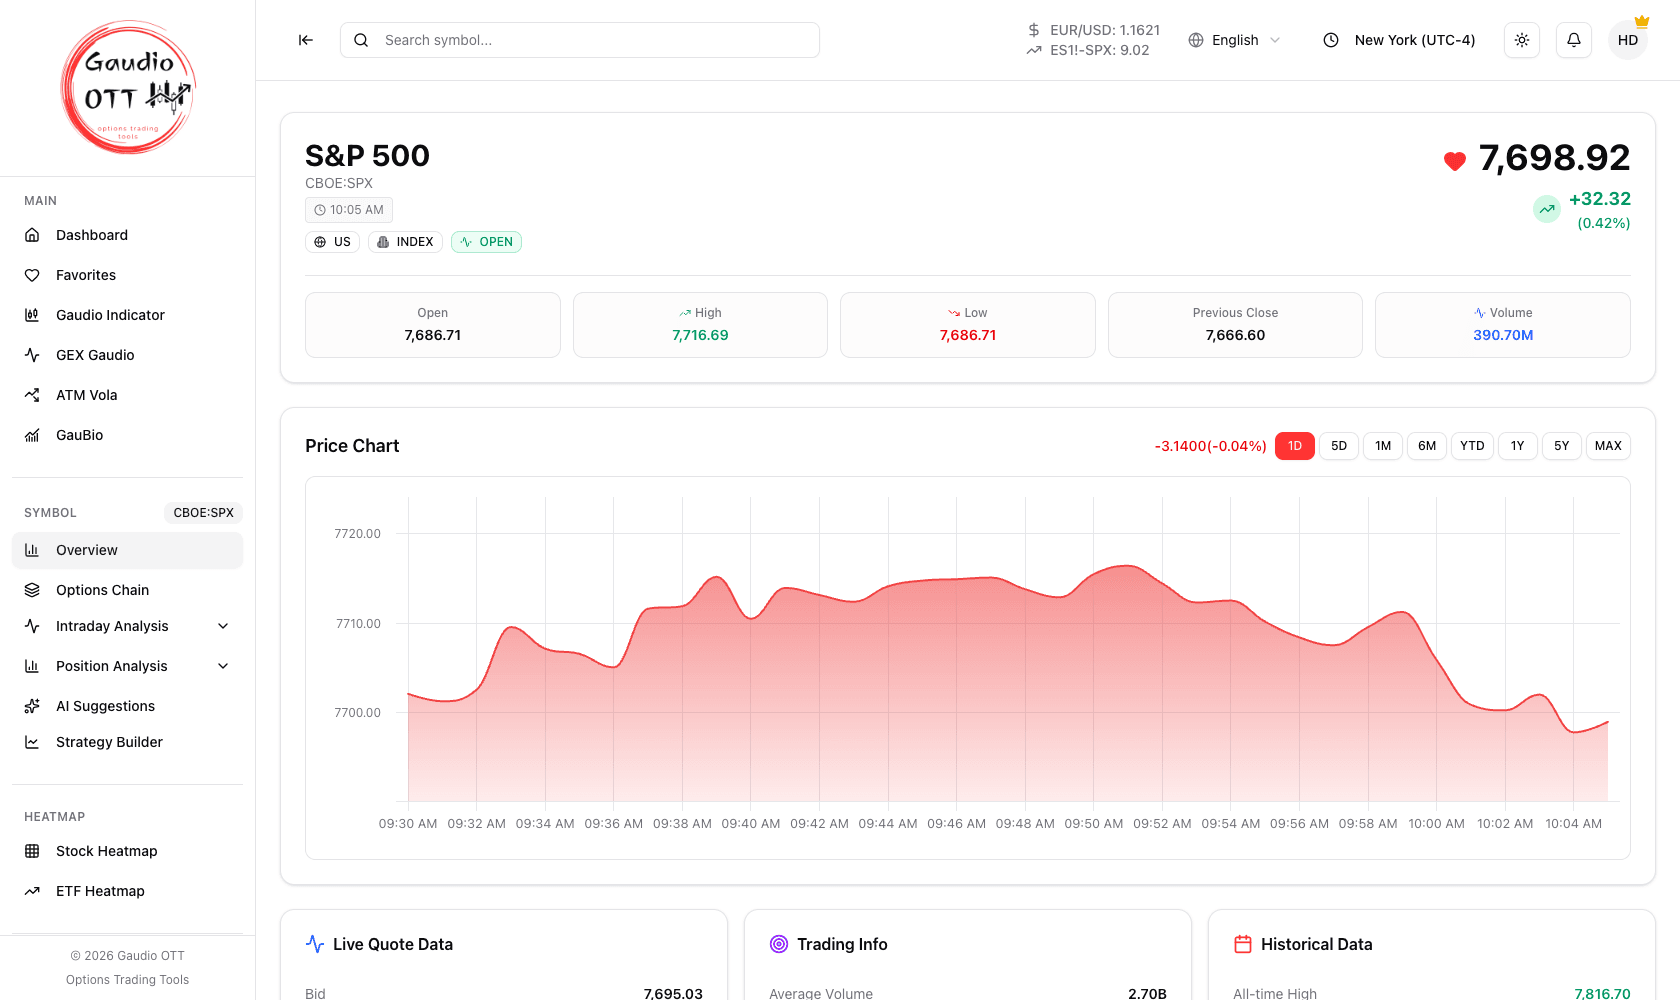
The symbol overview: header with price, change and market status, the session cards, and the historical chart with its timeframe buttons.
The header
Section titled “The header”At the top you find the name and code of the instrument, the current price with the absolute and percentage change for the day, and badges describing its nature — country, currency and type (index, stock, ETF, futures) — plus the market status: open, pre-market, post-market or closed.
The heart icon adds or removes the instrument from your favorites.
Session data
Section titled “Session data”The cards under the header summarise the day: Open, High, Low, Previous Close and Volume. For stocks they continue with Capitalization, P/E Ratio and Dividend Yield, and a Description card below tells you what the company does.
The price chart
Section titled “The price chart”The Price Chart shows how the instrument has behaved. The timeframe buttons switch from an intraday view to a long-period one: 1D, 5D, 1M, 6M, YTD, 1Y, 5Y, MAX. It is the fastest way to judge whether today’s move matters in the bigger picture.
The other cards
Section titled “The other cards”Below the chart, depending on the instrument:
- Live Quote Data — bid and ask, each with its size;
- Financial Metrics — for stocks: earnings per share (trailing twelve months, last quarter and the forecast for the next one), total revenue and dividend per share;
- Trading Info — average volume, market open and close times, regular close, point value and minimum tick;
- Historical Data — all-time high and all-time low, each with its date;
- Earnings — for stocks: the date of the last earnings release and of the next one;
- Options — one row per options product listed on the instrument, with how many chains it has. The Expirations button lists the expiration dates: pick one and the Options Chain opens on it.
Cards with nothing to show for that instrument are simply absent: an index has no capitalization, and a symbol without listed options has no Options card.
When the data is read
Section titled “When the data is read”The overview reads its data when you open it: price, session cards and chart are real time at that moment, but the page does not refresh on its own and has no countdown. To see fresh values, reload the page or open the symbol again. See Is the data real time?
Why traders use it
Section titled “Why traders use it”It is the sanity check before committing to an analysis. Three things decide whether the rest of the workflow will work at all: whether the market is open, whether the instrument has listed options (the Options card tells you immediately), and whether today’s range is meaningful against the all-time and longer-period context. Skipping it is how people end up debugging an empty options chain that was simply never listed.
How to use it inside Gaudio OTT
Section titled “How to use it inside Gaudio OTT”Open the Overview whenever you want a quick read of an instrument: price, change and historical context in one screen. From here, using the side menu, you move to the Options Chain, the intraday analyses, the position studies or the Strategy Builder — all of them referring to this symbol.
Common mistakes
Section titled “Common mistakes”- Ignoring the market status badge. A flat price on a closed market is not a quiet market.
- Reading the change without the timeframe context. Switch the chart to 1M or 1Y before concluding a move is large.
- Moving to the options analyses on an instrument with no expirations. The Options card tells you up front whether there are any.
Frequently asked questions
What does the Gaudio OTT symbol overview show?
The instrument name and code, current price with absolute and percentage change, country, currency and type badges, market status, session Open, High, Low, Previous Close and Volume, a historical price chart with selectable timeframes, live quote details, trading information, financial metrics, all-time high and low, the earnings dates for stocks, and the available option expirations.
Which timeframes does the overview chart support?
1D, 5D, 1M, 6M, YTD, 1Y, 5Y and MAX, selectable with the buttons above the chart.
How do I know whether an instrument has listed options?
The Options card on the overview shows the number of available expirations and series. If it is empty, the instrument has no options chain, and the options analyses will have nothing to show.
What does the market status badge mean?
It states whether the market for that instrument is open, in pre-market, in post-market, or closed. It matters because a flat price on a closed market is not the same as a quiet session.
How do I get from the overview to the options analysis?
Use the Symbol section of the side menu, which follows the active symbol: Options Chain, Intraday Analysis, Position Analysis, AI Suggestions and Strategy Builder all refer to the instrument you are viewing. The Options card also offers a direct shortcut into the chain.
Related pages
Section titled “Related pages”Ready to use Gaudio OTT?
Section titled “Ready to use Gaudio OTT?”Open your free account and put what you just read into practice.