

Gaudio Indicator
The Gaudio Indicator page shows a real-time futures chart with the market maker levels of the day and the proprietary Summa panel below it. It is the page for reading, in one screen, where price is relative to the day’s reference levels and in what state of volatility it is moving.
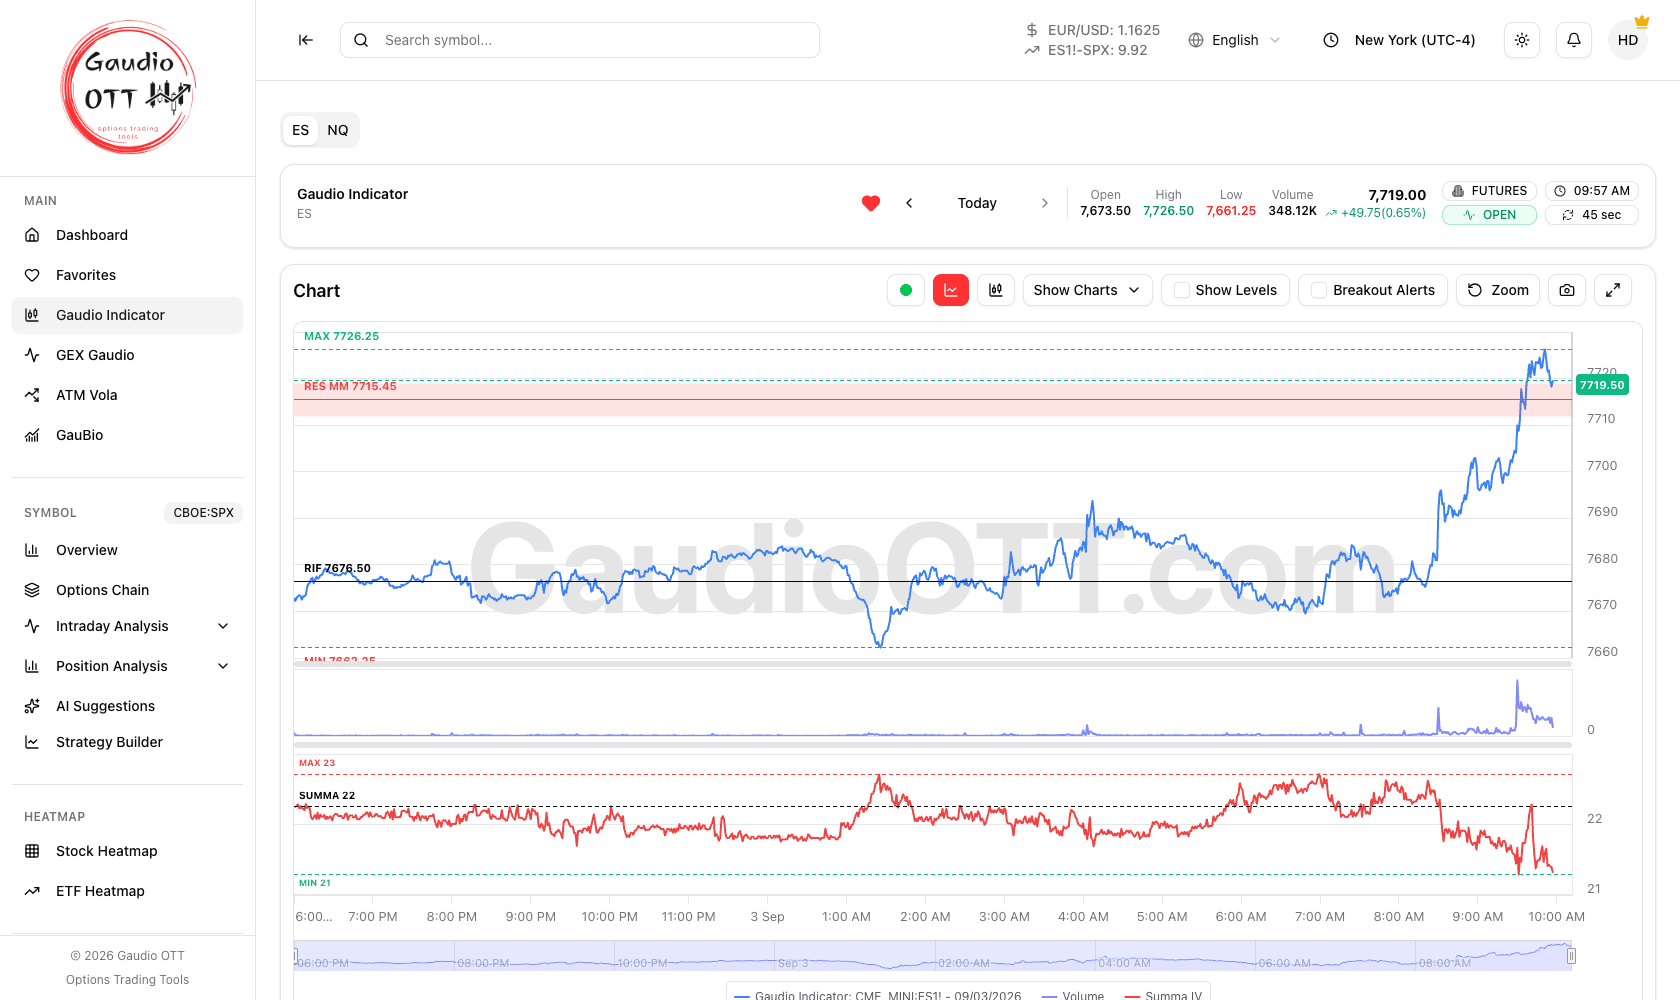
The Gaudio Indicator: the ES and NQ tabs, the price chart with the day’s levels, and the panels selected under Show Charts.
Where it is
Section titled “Where it is”Side menu, Main → Gaudio Indicator. Available on the Premium and Ultra plans.
Choosing the symbol: ES or NQ
Section titled “Choosing the symbol: ES or NQ”The tabs at the top left select the instrument to analyse: ES (S&P 500 future) or NQ (Nasdaq 100 future). Switching tab updates the chart, the levels and the indicator to the selected symbol.
The arrows next to the date move you between sessions — Today, the previous day, and so on. When you move back in time the header marks the view as Historical, and Breakout Alerts are disabled since there is nothing live to alert on.
If the market is closed or today’s data is not available yet, a yellow banner states that the page is showing the last available session, with its date.
What the chart shows
Section titled “What the chart shows”The chart sets its timeframe automatically depending on your monitor size and the zoom level, ranging from 1 minute to a maximum of 10 minutes per candle.
Every day the following levels are calculated automatically and drawn on the chart:
- the reference price line of the previous session;
- the market maker resistance;
- the market maker support.
These are reference areas to watch price reacting around, not buy or sell signals.
Below the price, a histogram shows the volume of the corresponding candle.
The Summa panel
Section titled “The Summa panel”At the bottom of the page sits the proprietary Summa indicator. Summa describes the current state of market volatility and makes anomalies visible.
The base rule is simple: the market normally rises with volatility falling and falls with volatility rising. When that does not happen — the market drops but Summa does not rise as it should — you are looking at a divergence, which is often an early cue of a change in price behaviour. See Summa for how to read it.
Chart controls
Section titled “Chart controls”- Line chart / Candlestick chart — switch between a continuous price line and Japanese candles.
- Show Charts — choose which panels are visible: Price, Volume, Summa.
- Show Levels — turn the levels on the chart on or off.
- Breakout Alerts — get notified when price breaks one of the levels. The alerts are named after the level they refer to: ResMM Breakout and SupMM Breakout.
- Zoom and pan — use the mouse wheel over the chart to zoom the time, and drag it with the left button held down to move around. On a trackpad, a horizontal two-finger swipe moves the time, while a vertical swipe and the pinch zoom; on touch devices, pinch to zoom and move with two fingers. The price scale follows the part of the chart you are looking at by itself.
- Navigator bar at the bottom of the chart — restrict the view to a specific time span, or keep the live view on the last few hours only for a clearer picture.
- Reset zoom, Save chart (screenshot) and Fullscreen in the top-right icons.
How to use it
Section titled “How to use it”Open it at the start of the session to note where the day’s support and resistance sit relative to the opening price, then leave Breakout Alerts on so you do not have to watch the chart continuously. Use the Summa panel for context: the same break of a level means something different when volatility is confirming the move and when it is diverging from it.
Common mistakes
Section titled “Common mistakes”- Treating the market maker levels as signals. They are reference zones; a clean break accompanied by volume is more meaningful than a touch.
- Expecting alerts in historical mode. Breakout Alerts only work on the live session.
- Reading Summa as a direction indicator. It describes volatility state, and its value is in the agreement or divergence with price.
- Looking for other symbols. The page covers ES and NQ. For SPX gamma see GEX Gaudio; for ES, SPX, NQ and NDX levels see GauBio.
Frequently asked questions
What does the Gaudio Indicator show?
A real-time chart of the ES or NQ future with the previous session reference price line and the automatically calculated market maker support and resistance levels, a volume histogram, and the proprietary Summa panel describing the current state of market volatility.
Which symbols does the Gaudio Indicator cover?
Two: ES, the S&P 500 future, and NQ, the Nasdaq 100 future. You switch between them with the tabs at the top left, and the chart, levels and indicator update accordingly.
What timeframe does the Gaudio Indicator chart use?
It is set automatically depending on your monitor size and the zoom level, from one minute up to a maximum of ten minutes per candle.
What is Summa?
Summa is the proprietary indicator in the lower panel of the Gaudio Indicator page. It describes the current state of market volatility and highlights anomalies: the market normally rises with volatility falling and falls with volatility rising, so when that relationship breaks you have a divergence worth noting.
How do I get an alert when price breaks a level?
Enable Breakout Alerts in the chart toolbar. You are then notified when price breaks the market maker resistance or support, with alerts named ResMM Breakout and SupMM Breakout. Alerts are disabled when viewing a historical session.
Can I look at previous sessions?
Yes. The arrows next to the date move between sessions, and the header marks the view as Historical. Breakout Alerts are switched off in that mode.
Which plans include the Gaudio Indicator?
Premium and Ultra.
Related pages
Section titled “Related pages”Ready to use Gaudio OTT?
Section titled “Ready to use Gaudio OTT?”Open your free account and put what you just read into practice.