

GEX Gaudio
GEX Gaudio is the real-time view of the market’s gamma exposure, organised by price level. It shows at a glance where gamma concentrates and how that relates to the current price. If you want the concept first, read What is GEX?.
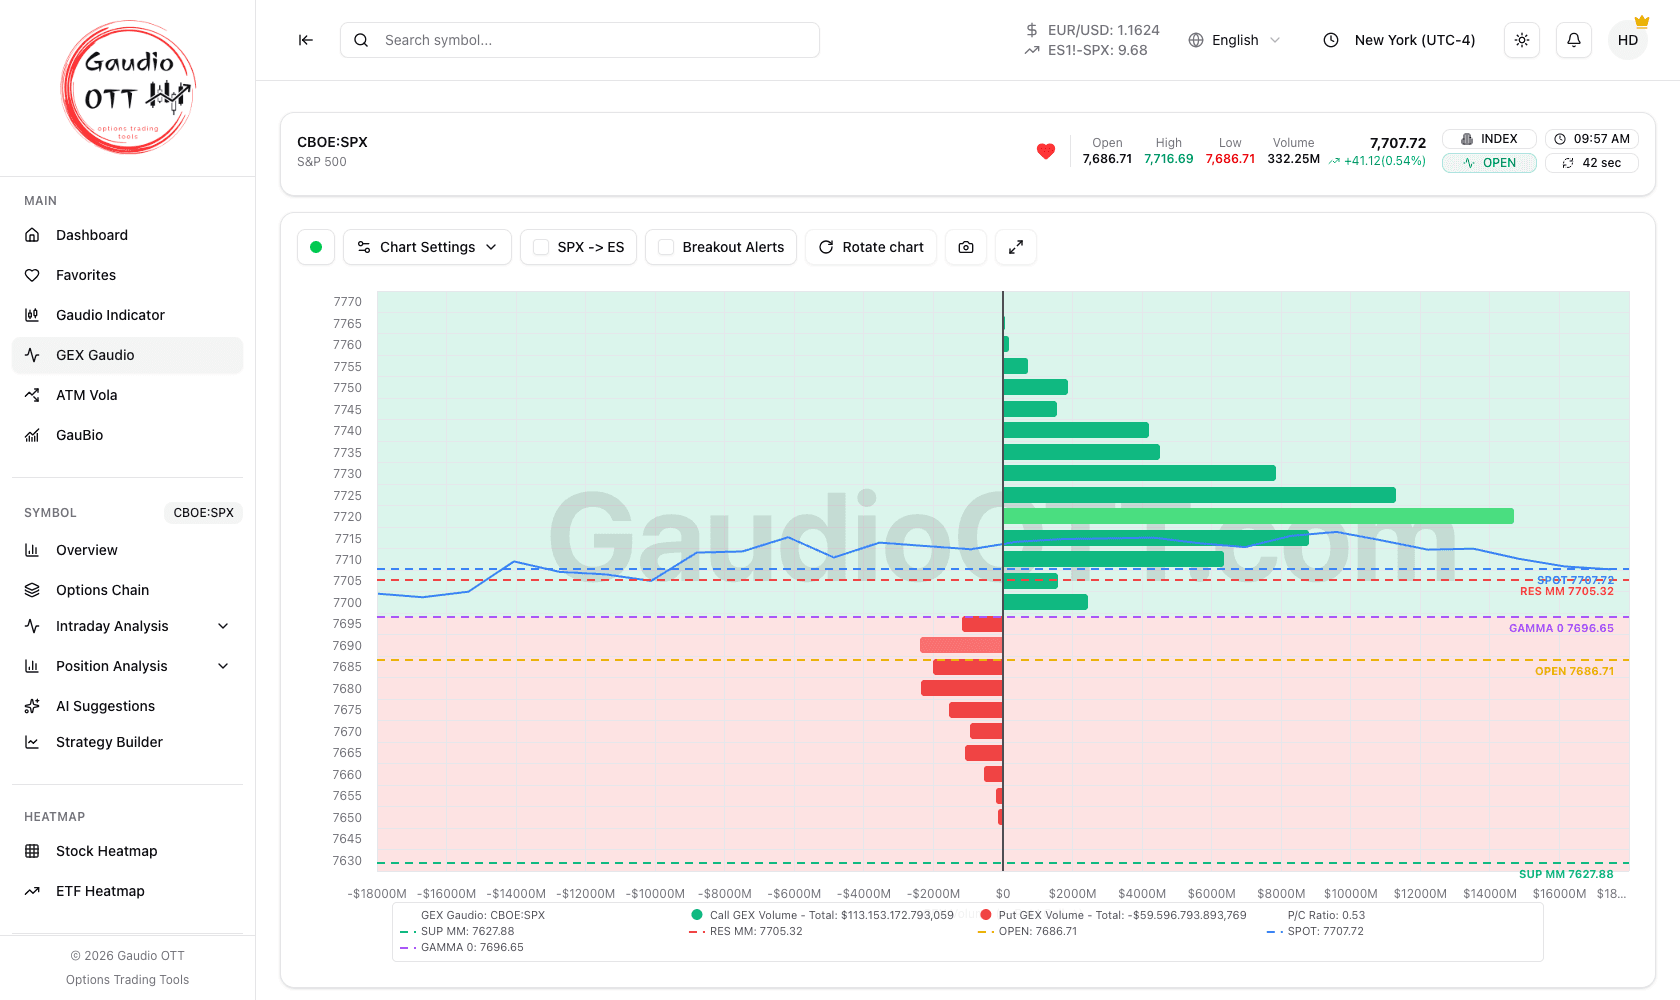
GEX Gaudio on SPX: call gamma in green, put gamma in red, the GEX history dots, the gamma wall lines next to the price and the SPOT, RES MM, SUP MM, OPEN and GAMMA 0 levels.
Where it is
Section titled “Where it is”Side menu, Main → GEX Gaudio. Available on the Premium and Ultra plans. The page is built on SPX, the S&P 500 index, with an option to translate the levels onto the ES future.
How to read it
Section titled “How to read it”- The horizontal bars represent gamma at each price level: one colour for the positive (call) component, one for the negative (put) component.
- The price line is the session so far: it runs across the left half of the chart and stops just short of the central axis, leaving the other half to the bars and dots. It tells you where the market has moved relative to the gamma concentrations; the current price is the dashed SPOT line.
- The dashed level lines are labelled with their value and repeated in the legend: SPOT (current price), OPEN (session open), RES MM and SUP MM (the market maker resistance and support) and GAMMA 0 — the point where gamma changes sign, the key reference. See Gamma Flip (Gamma 0). SPOT and GAMMA 0 are always shown; SUP MM, RES MM and OPEN are turned on and off with Show Levels. When two levels are a few points apart, their labels move apart to stay readable.
- The legend below the chart opens with the symbol in bold (SPX, or ES with SPX → ES on), gives the call and put gamma totals (Call GEX and Put GEX), the Call wall and Put wall entries for the wall lines, the P/C Ratio of gamma and the levels, and ends with the Max change GEX line of the history. On a wide chart it fits on two rows.
- The dots on the bars are the GEX history: where each bar stood over the last 30 minutes. They are explained below.
The GEX history: the dots
Section titled “The GEX history: the dots”With GEX History on (it is by default) every bar carries dots: they are the value that same bar had 1, 5, 10, 15 and 30 minutes ago, and each interval has its own colour and shape: 1 minute a near-white circle, 5 a light blue square, 10 a dark blue diamond, 15 a purple triangle, 30 a black circle. The colour runs from light (recent) to dark (old), and the shape keeps them apart even when two dots land almost on the same spot; the legend shows each one’s shape. If you prefer plain dots, turn off the Shapes checkbox next to GEX History: they all become circles, with the same colours. Hover a dot to see the strike, the interval and the value. With Net Positions on there is one dot per interval on the strike’s net GEX; otherwise two, one on the call bar and one on the put bar.
They tell you the direction, which a bar alone does not. A long bar can be gamma built at the open and now standing still, or gamma building right now: the dots tell the two apart.
- Bar beyond its dots: gamma on that strike is growing. During the session the bars are computed on volume, which can only rise, so it means contracts traded there or price moving towards the strike.
- Dots beyond the bar: gamma is shrinking, almost always because price is moving away from the strike.
- Dots gathered at the tip of the bar: the strike is standing still.
The Max change GEX line at the end of the legend gives, for each interval, the strike whose net GEX changed the most and by how much, green if it grew and red if it fell. It is the quick way to see where gamma has moved in the last few minutes without scanning the whole profile.
The gamma walls over time
Section titled “The gamma walls over time”Next to the price line, again with GEX History on, run two dashed lines: the green one follows the strike carrying the largest call gamma, the red one the strike carrying the largest put gamma, minute by minute since the open. They are the strikes of the Max Call Strike and Max Put Strike cards, with their history. With Net Positions on they follow the largest positive and the largest negative net instead. In the legend they are the Call wall and Put wall entries.
The lines step: they stay on a strike until the wall moves, and jump in the minute it changes. They show whether the call or put wall is moving during the session and whether price follows it, stalls against it or pulls away from it. In the first minutes after the open, on little volume, the wall can jump between neighbouring strikes: the line settles as the session goes on.
The history refreshes once a minute and exists only while the market is open: once it closes the chart switches to open interest and the legend says so. It builds up with the session, because snapshots taken before the 9:30 New York open are computed on the previous evening’s price: in the first minutes the dots appear one interval at a time, and after half an hour they are all there.
The summary cards
Section titled “The summary cards”| Card | What it shows |
|---|---|
| Spot Price SPX | Current SPX price |
| Last Update | Time of the last refresh |
| Expiration | The expiration the profile refers to |
| Total Call GEX Volume | Aggregate call-side gamma exposure |
| Total Put GEX Volume | Aggregate put-side gamma exposure |
| GEX Difference | Net difference between the two sides |
| Support MM / Resistance MM | The market maker support and resistance levels |
| Max Call Strike / Max Call GEX | The strike carrying the largest call gamma, and its value |
| Max Put Strike / Max Put GEX | The strike carrying the largest put gamma, and its value |
| Max Call/Put Strike Net and GEX Net | The same extremes computed on the net profile |
The controls
Section titled “The controls”- Chart Settings — display options: Show Levels, Net Positions, Gamma Flip and Price Trend. Show Levels turns the SUP MM, RES MM and OPEN lines on and off: if one falls outside the part of the chart you are looking at, zoomed in or not, the view widens until it shows; if they are already in view it stays as it is.
- SPX → ES — translates the SPX index levels onto the ES future, which is convenient if you trade the future. When enabled, an offset control lets you use the automatically computed spread or set your own.
- GEX History — shows or hides the history dots, the Max change GEX line and the gamma wall lines. The choice is saved.
- Breakout Alerts — notifies you when price breaks a relevant level.
- Zoom and pan — the mouse wheel (or a vertical two-finger swipe on a trackpad) zooms the strikes, and dragging the chart with the left button moves around. When the strikes run horizontally (with Rotate chart), a horizontal two-finger swipe moves them too. On touch devices, pinch to zoom and move with two fingers.
- Rotate chart, Screenshot and Fullscreen for the display, plus a Reset Zoom button once you have zoomed in.
How to use it
Section titled “How to use it”Watch where price sits relative to the Gamma Flip and to the largest gamma concentrations: those are the areas where market maker hedging activity can most influence the intraday move. During the session, watch the dots on the bars closest to price: they tell you whether that concentration is strengthening or losing weight. The Support MM and Resistance MM cards give you the two levels to note at the start of the session; Breakout Alerts then tells you when one of them gives way, so you do not have to watch continuously.
If you trade ES rather than SPX, turn SPX → ES on before writing the levels down — otherwise you will be working from index prices on a futures chart.
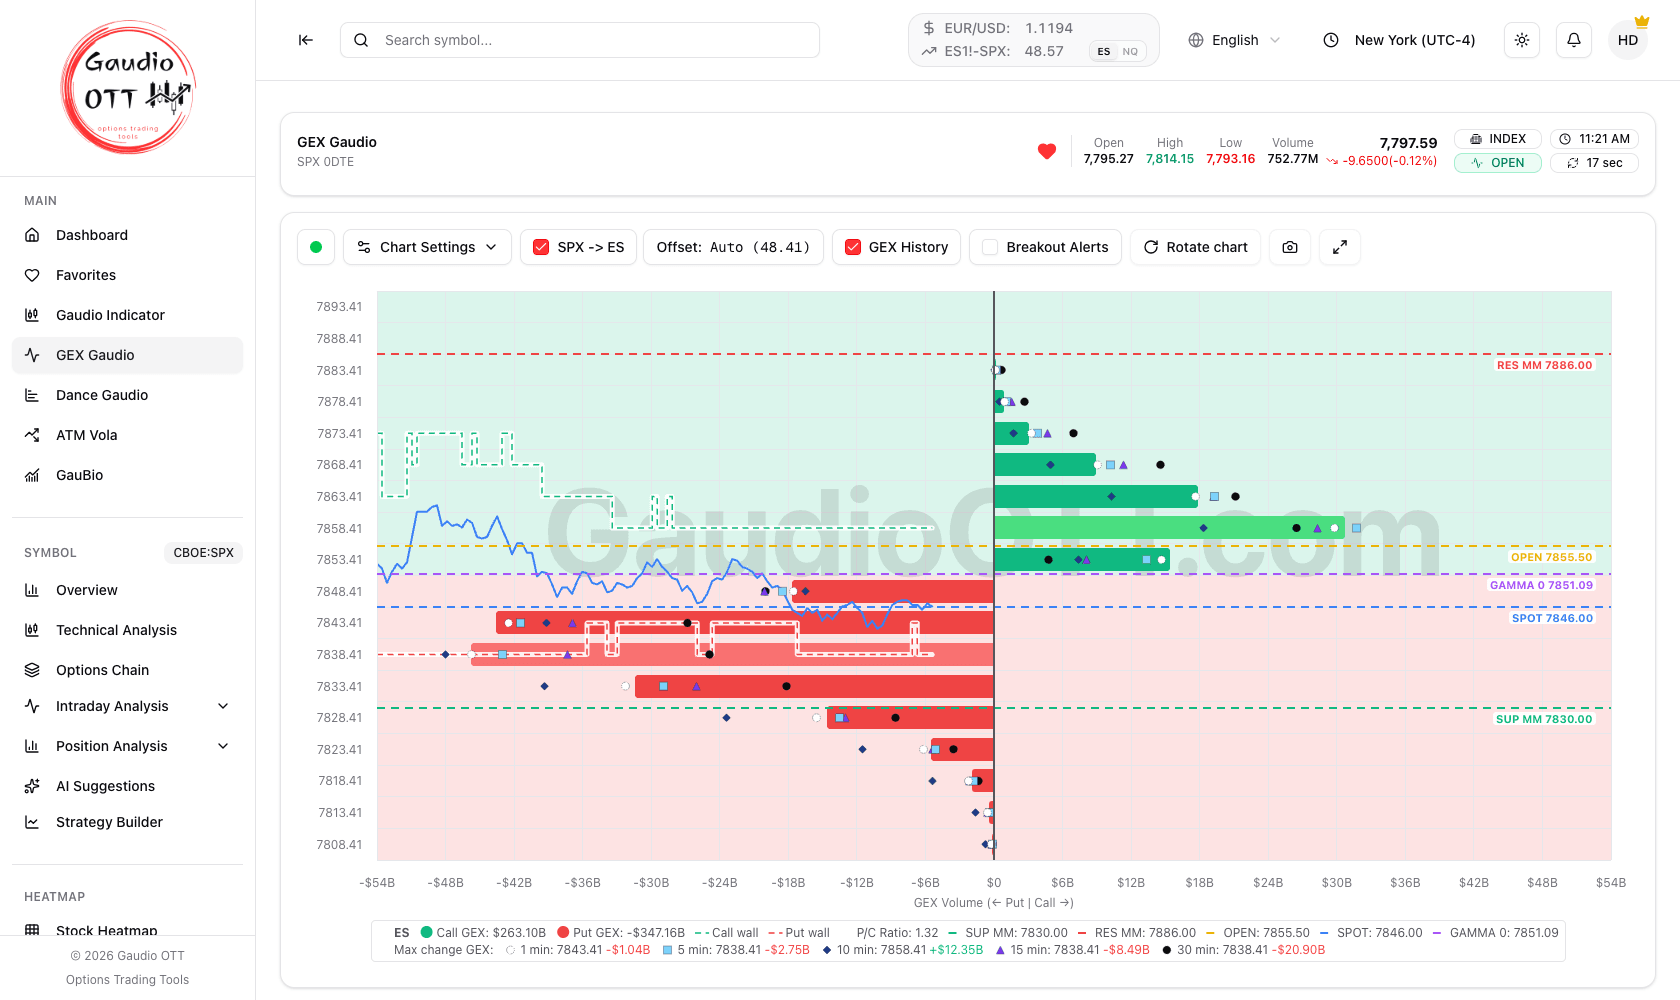
The same profile with SPX → ES on: strikes, levels and dots are translated onto the ES1! future with the automatically computed offset, ready to carry over to the platform you trade the future on.
Common mistakes
Section titled “Common mistakes”- Copying SPX levels onto an ES chart without converting. Use the SPX → ES toggle; the two are not interchangeable.
- Reading the profile as support and resistance. Gamma concentrations condition how price behaves around a level; they are not levels of supply and demand.
- Reading the dots as levels. A dot is neither a support nor a target: it is only the value the bar had a few minutes earlier.
- Ignoring which expiration the profile refers to. The Expiration card tells you, and it changes what the profile means.
- Comparing totals with the per-strike GEX pages. Those cover the active symbol and a different contract population; compare shapes, not absolute values.
Frequently asked questions
What is the GEX Gaudio page?
It is the real-time view of market gamma exposure organised by price level, built on the SPX index. Horizontal bars show the gamma at each level with the call and put components separated, the spot price line crosses the chart, and the Gamma Flip marks where gamma changes sign.
What does the SPX to ES toggle do?
It translates the SPX index levels onto the ES future, so traders who work on the future can read the same gamma profile in futures prices. When enabled you can use the automatically computed spread or enter your own offset.
What are Support MM and Resistance MM on the GEX Gaudio page?
They are the market maker support and resistance levels for the session, shown as summary cards under the chart. They are reference areas to watch price react around, not trading signals.
How do I get notified when price breaks a GEX Gaudio level?
Enable the Breakout Alerts checkbox in the chart toolbar. You are then alerted when price breaks a relevant level, so you do not have to watch the chart continuously.
What are the dots on GEX Gaudio?
They are the GEX history: on each bar, the value that same bar had 1, 5, 10, 15 and 30 minutes ago, each with its own colour and shape, from the near-white circle of 1 minute to the black circle of 30 minutes. They tell you whether gamma on a strike is growing or shrinking. The Max change GEX line in the legend gives, for each interval, the strike that changed the most. The history exists only while the market is open and can be hidden with the GEX History checkbox.
What are the green and red dashed lines next to the price on GEX Gaudio?
They are the gamma walls over time: the green one follows the strike carrying the largest call gamma, the red one the strike carrying the largest put gamma, minute by minute since the open. They show whether a wall moves during the session and how price behaves around it. They appear with the GEX History checkbox, and only while the market is open.
Which plans include GEX Gaudio?
Premium and Ultra.
What is the difference between GEX Gaudio and the intraday GEX charts?
GEX Gaudio shows the SPX gamma profile organised by price level, with market maker levels and the SPX to ES conversion. The intraday GEX Open Interest and GEX Volumes charts show gamma per strike for whichever symbol is active, one computed on open contracts and the other on the volume traded today.
Related pages
Section titled “Related pages”Ready to use Gaudio OTT?
Section titled “Ready to use Gaudio OTT?”Open your free account and put what you just read into practice.