

Volatility chart
In the Volatility section you follow how implied volatility evolves for a specific underlying and expiration, and you can monitor several volatility skews at the same time.
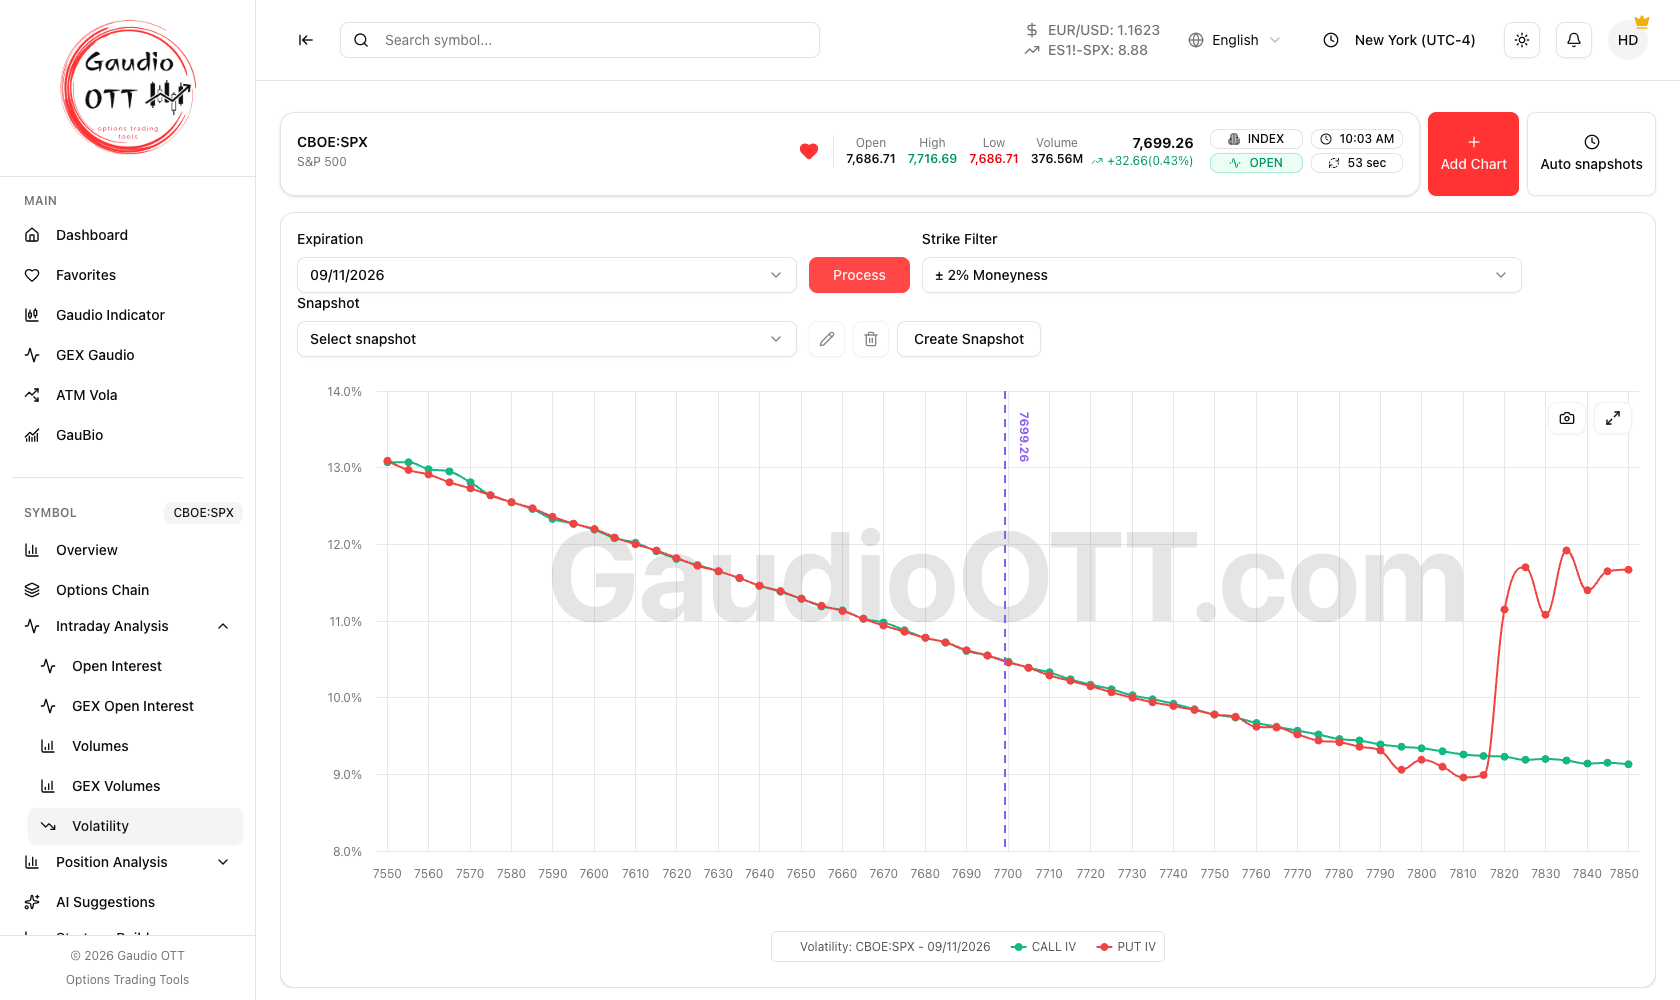
The volatility section: the skew of one expiration, with the Snapshot row and the Auto snapshots panel above it.
Where it is
Section titled “Where it is”Side menu, Symbol → Intraday Analysis → Volatility. It refers to the active symbol. Available on the Premium and Ultra plans.
Adding and managing charts
Section titled “Adding and managing charts”With the Add Chart button you insert a new volatility chart. For each chart you choose the expiration from the dropdown and press Process: the chart then loads with the skew of that expiration.
You can keep up to six charts open at the same time per symbol, to compare different expirations at a glance. The Add Chart button is disabled once you reach the limit.
Strike filter
Section titled “Strike filter”Each chart has its own Strike Filter: choose one of the moneyness presets — from ± 1% to ± 50% — or set a custom minimum and maximum, to focus the chart on the strikes you care about.
Manual snapshots
Section titled “Manual snapshots”Each chart has its own Snapshot row: a Select snapshot dropdown to load a saved one, a Create Snapshot button to save the current state under a name, and rename and delete actions for the ones you already have. This is the snapshot you take deliberately, at a moment you decide.
Automatic snapshots
Section titled “Automatic snapshots”The Auto snapshots panel, at the top right of the page, saves the state of your charts automatically at preset times, without you being at the screen:
- you can set up to three times per day, Monday to Friday, expressed in the timezone configured on your account;
- at each time, one snapshot is saved for every expiration present on the page;
- automatic snapshots are kept for 7 days.
To configure them: open the panel, use Add time to insert the times you want, and confirm with Save times. From that moment snapshots are generated automatically at the set times, and each one carries an Auto badge to distinguish it from a manual save.
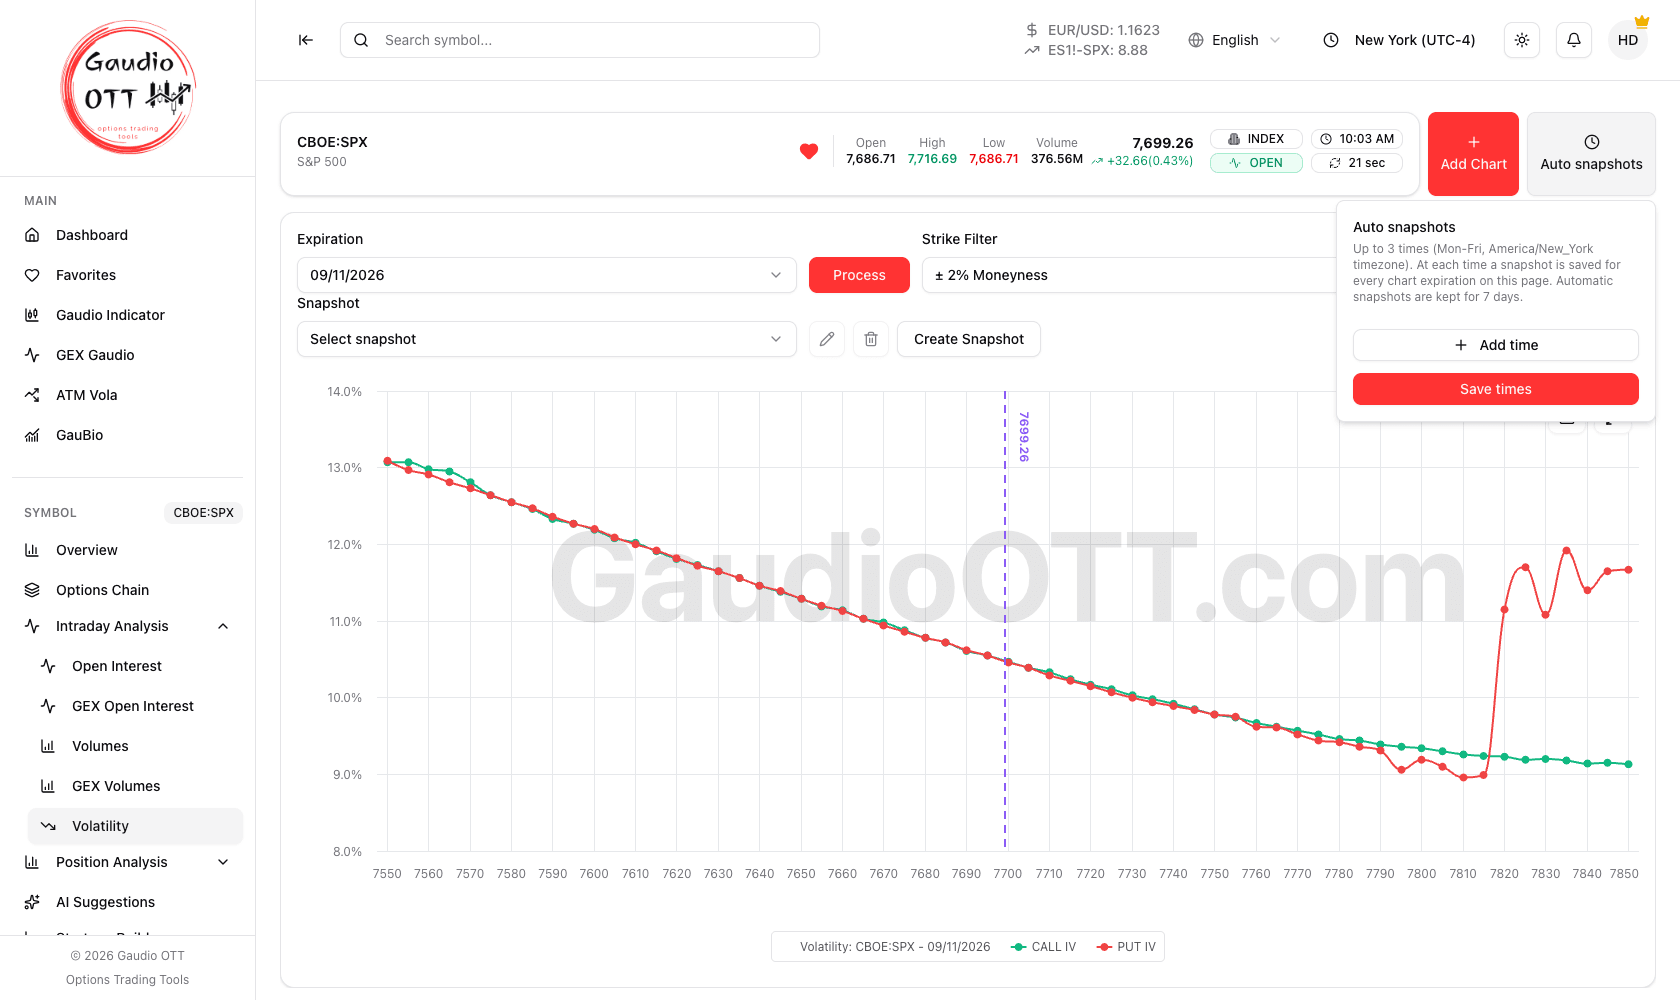
The Auto snapshots panel states the rules it applies: up to three times, Monday to Friday, in your account timezone, kept for 7 days.
Why traders use it
Section titled “Why traders use it”A single skew tells you what the market charges for tails right now. What you actually want to know is whether that price is changing, and the snapshots are how you find out without watching the screen. Setting times around the key moments of the session — open, midday, close — means reopening the page brings back the picture of volatility at those moments, so you can compare how the skew moved rather than guessing.
Keeping several expirations open at once turns that into a term-structure read: when the near expiration steepens while the far one does not, the market is pricing a specific event, not a change in regime.
Common mistakes
Section titled “Common mistakes”- Forgetting to press Process. Selecting an expiration is not enough; the chart loads on Process.
- Setting snapshot times in the wrong timezone. They follow the timezone selector on your account, not your operating system.
- Expecting automatic snapshots older than a week. Automatic snapshots are retained for 7 days by design; the manual ones you create are not on that clock.
- Comparing skews with different strike filters. Two charts filtered differently are not visually comparable; align the filters first.
Frequently asked questions
How many volatility charts can I open at once?
Up to six per symbol. Each chart shows the skew of one expiration, so you can compare several expirations side by side. The Add Chart button is disabled once the limit is reached.
How do automatic volatility snapshots work?
You set up to three times per day, Monday to Friday, in the timezone configured on your account. At each time one snapshot is saved for every expiration present on the page, and automatic snapshots are kept for 7 days. Each one is marked with an Auto badge.
Why does my volatility chart stay empty after choosing an expiration?
Because the chart loads only after pressing Process. Selecting the expiration from the dropdown is the first step; Process fetches and draws the skew.
How long are automatic snapshots kept?
Seven days. After that they are removed automatically. The snapshots you create by hand with Create Snapshot, here or on the position analysis pages, are not on that seven-day clock.
Which plans include the volatility chart?
Premium and Ultra. It belongs to the Intraday feature group and is not available on the Free or Strategy plans.
What strike ranges can I filter to?
Presets of ± 1%, ± 2%, ± 5%, ± 10%, ± 20%, ± 30% and ± 50% around the current price, plus an All option and a custom minimum-to-maximum range. Each chart has its own filter.
Related pages
Section titled “Related pages”Ready to use Gaudio OTT?
Section titled “Ready to use Gaudio OTT?”Open your free account and put what you just read into practice.