

Open Interest study
In the Open Interest study you see, strike by strike, where operators have placed their contracts — the strikes carrying the market’s largest interest. Unlike the intraday chart, this one can aggregate several expirations at once and lets you save snapshots to compare across days.
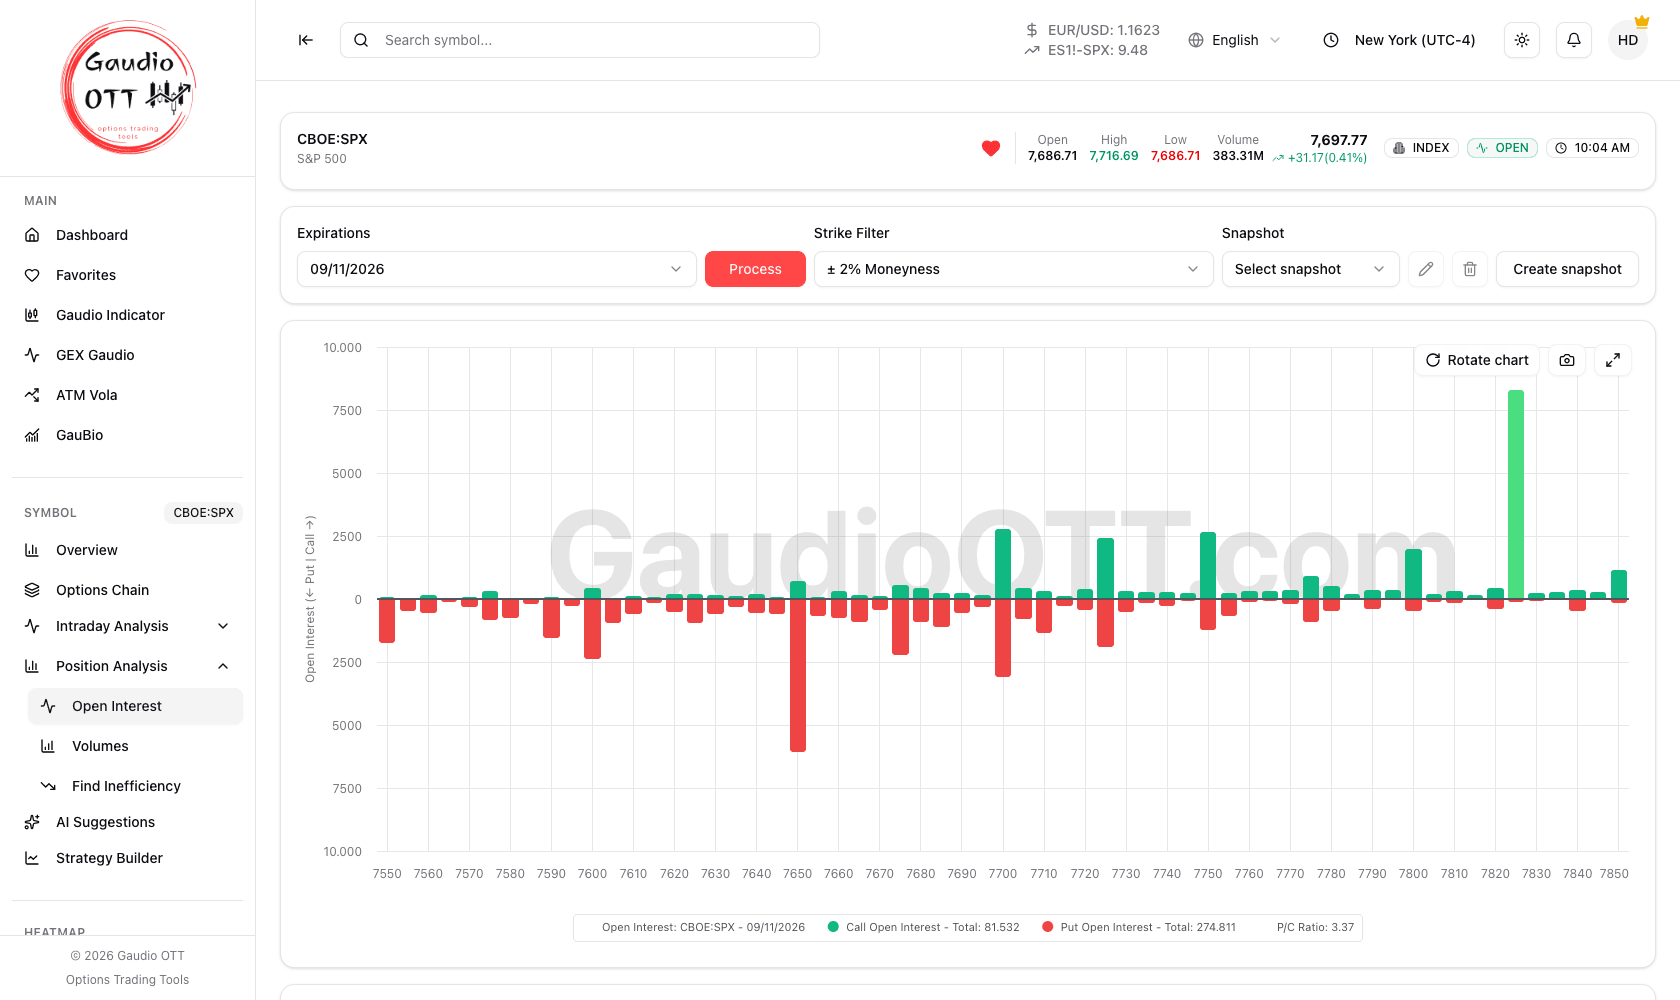
Open Interest per strike for one expiration: calls in green, puts in red, with the call and put totals and the Put/Call ratio in the legend.
Where it is
Section titled “Where it is”Side menu, Symbol → Position Analysis → Open Interest. It refers to the active symbol and is available on all plans, including Free.
Use it on the symbols institutional desks follow most — SPX, NDX, VIX, GLD and similar. It also works on futures, within the limits described in On futures.
How to run an analysis
Section titled “How to run an analysis”- Open the Expirations selector and tick one or more expiration dates. Each date shows the weekday and the days remaining; All and Clear at the top select or clear the whole list.
- Press Process. Until then the chart area reads Select at least 1 expiration.
- Optionally narrow the strikes with the Strike Filter, which appears after the first Process.
With several expirations selected, the chart shows, strike by strike, the total contracts across all of them, which is how you see the aggregate positioning rather than a single series. There is no limit on how many you tick, but they are loaded one at a time, so All on SPX takes a while.
The chart is a picture of the data at the moment you press Process: it does not refresh by itself, press Process again to update it.
The page remembers your choices for each symbol — expirations, Strike Filter and selected snapshot — and on the next visit processes them again by itself.
Customising the view
Section titled “Customising the view”- Strike Filter — starts at ± 2% Moneyness. The menu offers All, Custom min to max (two strike prices), and ± 1%, ± 2%, ± 5%, ± 10%, ± 20%, ± 30% and ± 50% Moneyness; confirm with Apply. It filters the chart without processing again.
- Rotate chart — the bars start vertical, calls above the axis and puts below; Rotate chart lays them horizontally, puts on the left and calls on the right.
- Zoom with the mouse wheel; Reset Zoom appears to go back to the full range.
- The camera icon (Save chart) saves the chart as an image, the expand icon (Full screen) opens it full screen.
The legend gives the call and put totals and the P/C Ratio. The summary cards under the chart give Spot Price, Selected Expirations, Max Call Strike and Max Call Open Interest, Max Put Strike and Max Put Open Interest, and the Total Call and Total Put Open Interest. The “Max” cards look at every strike of the processed expirations, not only those the Strike Filter shows: the largest call strike can sit off the chart. The four “Max” cards keep their English labels in the Italian interface too.
Comparison snapshots
Section titled “Comparison snapshots”You can create a snapshot — a photograph of the current analysis — and compare it with those of following or previous days, to see how positions move over time. The Snapshot controls appear after the first Process.
- Create snapshot saves the processed expiration as it is now. No name is asked: the snapshot is named after the date and time and the call and put totals, for example 10/16/2026, 6:08:43 AM - Call: 73,940 | Put: 323,640.
- Pick a snapshot from the dropdown and it is drawn beside the current bars, with its own totals and P/C Ratio in the legend: that is the comparison. Right after Create the two series are identical.
- The pencil (Rename snapshot) gives it a name of your own, the bin (Delete snapshot) removes it.
- The dropdown lists only the snapshots of the processed expiration. A snapshot keeps every strike, so the Strike Filter applies to it as it does to the current bars.
Note: in multi-expiration mode the snapshot feature is not available: the dropdown reads Select one expiration and the buttons are disabled. Snapshots require exactly one processed expiration, so that what you compare across days is unambiguous.
Why traders use it
Section titled “Why traders use it”The intraday chart answers “where is interest today”. This one answers “where has interest moved”. Two snapshots of the same expiration a week apart show whether a concentration is being built, defended or rolled away, which is a different and usually more actionable question than the level of the largest bar.
Aggregating expirations serves the opposite purpose: it flattens the calendar to show the strikes that matter across the whole listed curve, which is where index-level support and resistance zones tend to emerge.
On futures
Section titled “On futures”It also works on futures with listed options, such as ES and NQ, with one difference from stocks and indices:
- Volume and open interest are only available for strikes near the price, about ±3% on ES. After Process the header says so with the Vol/OI only within ±X% notice, which gives the covered band (with several expirations, the narrowest one): a wider strike filter adds no data.
European symbols
Section titled “European symbols”- Italian stocks and the FTSE MIB, whose options trade on IDEM, work on end-of-day data: the header reads IDEM end-of-day open interest as of followed by the date, and each expiration in the list carries its product name, such as IDEM Weekly 4th Friday.
- Symbols whose options trade only on Eurex, such as German stocks and the DAX, also work on end-of-day data: the header reads Eurex end-of-day open interest as of followed by the date, and each expiration in the list carries its product name. For these symbols the Volume study shows the End of Day data card.
Common mistakes
Section titled “Common mistakes”- Expecting snapshots in multi-expiration mode. Process a single expiration to enable them.
- Widening the strike filter on a futures contract and expecting more bars. Volume and open interest only arrive within the band the header notice gives: past it, the chart does not change.
- Using it on illiquid names. Open Interest concentrations only carry information where there is real option volume.
- Expecting the chart to update by itself. It shows the data as of the last Process: press Process again to refresh it.
Frequently asked questions
What is the Open Interest study in Gaudio OTT?
A position analysis that charts, strike by strike, the number of open option contracts on the active symbol. It can aggregate several expirations at once and lets you save snapshots to compare positioning across days.
How is the Open Interest study different from the intraday Open Interest chart?
The intraday chart shows one expiration during the current session. The position study can total several expirations together and supports snapshots, so it is the tool for tracking how positioning changes over days rather than within a day.
Why can I not save a snapshot?
Because more than one expiration is processed. Snapshots require exactly one processed expiration, so that the comparison across days refers to a single, unambiguous series.
Does the Open Interest study work on futures?
Yes, on futures with listed options such as ES and NQ. Volume and open interest are only available for strikes near the price, though, about ±3% on ES, and the header notice gives the covered band.
Which plans include the Open Interest study?
All of them, including Free.
Which symbols work best for this analysis?
The instruments institutional desks follow most, such as SPX, NDX, VIX and GLD. Open Interest concentrations are only meaningful where option volume is genuinely large.
Related pages
Section titled “Related pages”Ready to use Gaudio OTT?
Section titled “Ready to use Gaudio OTT?”Open your free account and put what you just read into practice.