

Find Inefficiency
Find Inefficiency lets you monitor the value of a single strike across a range of expirations — a custom range or every expiration available. It is the tool for hunting price inefficiencies: expirations and strikes where options cost more than they should, situations often suited to targeted options strategies.
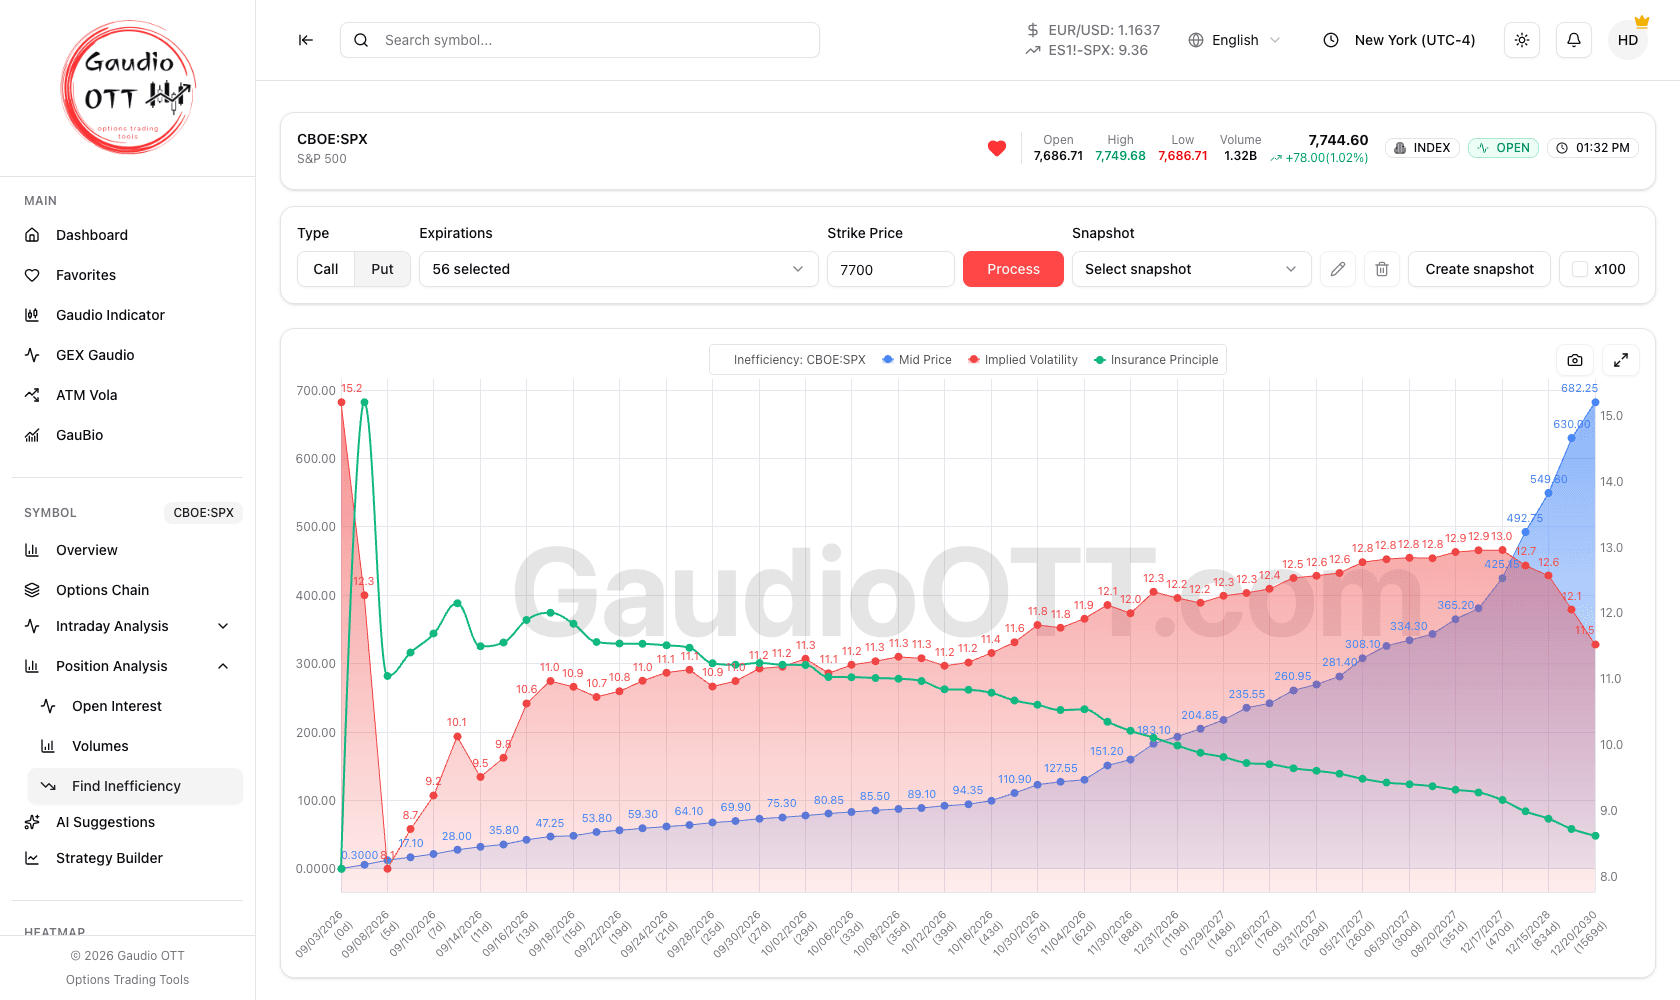
One strike followed across 56 expirations, with mid price in blue, implied volatility in red and the Insurance Principle in green.
Where it is
Section titled “Where it is”Side menu, Symbol → Position Analysis → Find Inefficiency. It refers to the active symbol. Available on the Premium and Ultra plans; it works on every symbol with listed options, futures included. On futures the expiry selector also shows the name of the option series, because several of them expire on the same future.
How to run an analysis
Section titled “How to run an analysis”- Choose the Type — Call or Put.
- Open Expirations and tick the dates to include, or use All to take every expiration available.
- Enter the Strike Price to follow across those expirations.
- Press Process.
The selector reports how many expirations are in play, for example 56 selected.
How to read the chart
Section titled “How to read the chart”The chart draws the chosen strike across the expiration axis, with three series:
- Mid Price — the mid price of the option on each expiration.
- Implied Volatility — the implied volatility on each expiration.
- Insurance Principle — the reference line for spotting inefficiencies.
The green Insurance Principle line is the one to watch: the more it slopes upward, the greater the inefficiency present in the prices. Following its behaviour day after day also helps track changes in volatility.
Under the chart, the Expiration Table lists each expiration with its Volatility, Mid Price, Bid, Ask and Theoretical Price, so you can read the exact numbers behind the curve.
The x100 checkbox
Section titled “The x100 checkbox”The x100 option multiplies option prices by 100. It is useful for reading currency prices more comfortably, and for seeing the real premium referred to one lot rather than a per-unit quote.
Comparison snapshots
Section titled “Comparison snapshots”Here too you can save a snapshot of the current analysis and compare it against following or previous days. Snapshots can be renamed and deleted.
Why traders use it
Section titled “Why traders use it”A single option’s price tells you very little in isolation. Laid out across the expiration curve, the same strike reveals whether one expiration is being paid up relative to its neighbours — which is exactly the situation a calendar or diagonal structure is designed to exploit. The Insurance Principle line compresses that comparison into one slope, so the read is visual rather than arithmetic.
Snapshots turn it into a tracking tool: an inefficiency that persists across days is a different proposition from one that appears on a single print.
Common mistakes
Section titled “Common mistakes”- Reading a steep slope as a trade. It flags where to look; liquidity, spread and event risk still decide whether the structure is workable.
- Comparing a call analysis with a put analysis. They are separate runs; keep the type constant when comparing days.
- Forgetting the x100 state when comparing snapshots. The same data looks two orders of magnitude apart with the checkbox on and off.
Frequently asked questions
What does Find Inefficiency do in Gaudio OTT?
It tracks the value of a single option strike across a range of expirations, plotting mid price, implied volatility and the Insurance Principle line, so you can spot expirations where options are priced more richly than they should be.
What is the Insurance Principle line?
It is the reference series used to identify inefficiencies in Find Inefficiency. The more it slopes upward, the greater the inefficiency present in the prices of the strike across expirations. Following it day after day also helps track changes in volatility.
What does the x100 checkbox do?
It multiplies option prices by 100, which makes currency prices easier to read and shows the real premium referred to one lot instead of a per-unit quote.
Which plans include Find Inefficiency?
Premium and Ultra. It is the only position analysis not included in the Free plan.
Does Find Inefficiency work on futures?
Yes. It works on every symbol with listed options, futures such as ES and NQ included.
What does the Expiration Table below the chart show?
One row per expiration with its volatility, mid price, bid, ask and theoretical price, so you can read the exact figures behind the plotted curves.
Related pages
Section titled “Related pages”Ready to use Gaudio OTT?
Section titled “Ready to use Gaudio OTT?”Open your free account and put what you just read into practice.