

GEX Volumes chart
The GEX Volumes chart shows gamma exposure strike by strike, computed on the option volume traded during the session. It is the fast-moving counterpart to GEX Open Interest: the gamma being created today, not the gamma already on the books.
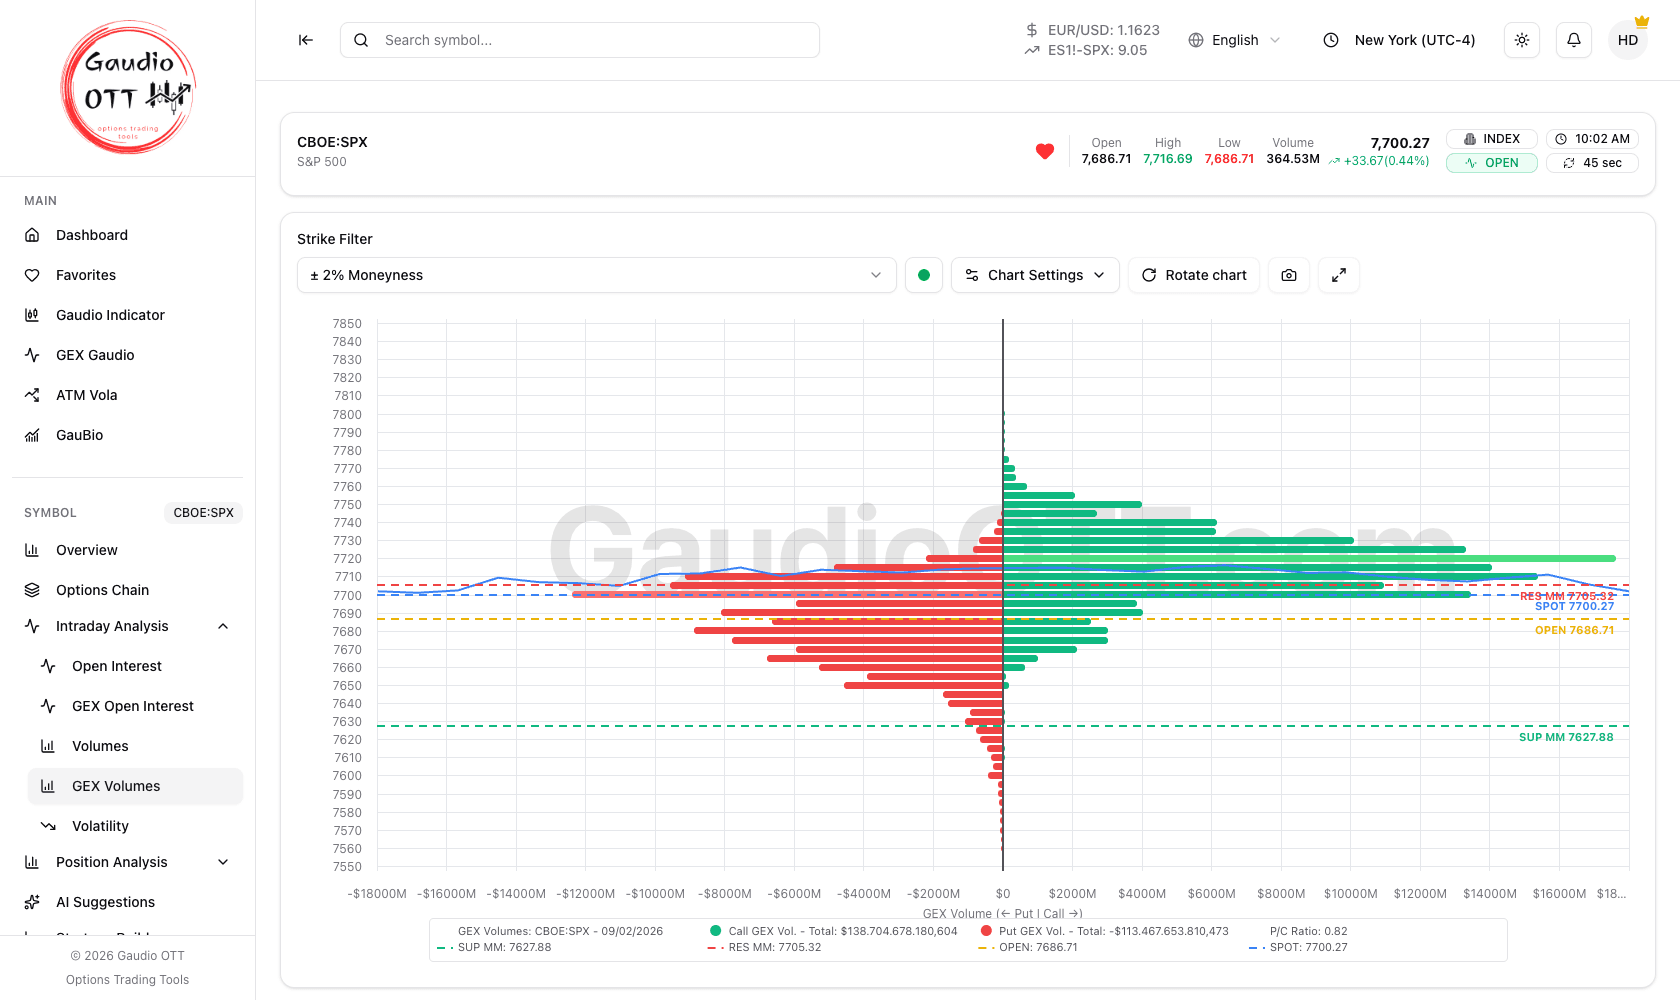
GEX per strike computed on the volume traded during the session.
Where it is
Section titled “Where it is”Side menu, Symbol → Intraday Analysis → GEX Volumes. It refers to the active symbol. Available on the Premium and Ultra plans; it also works on futures, within the limits described in On futures.
What this page shows
Section titled “What this page shows”- Bars per strike — the gamma exposure implied by today’s traded volume on that strike, with the call and put components in different colours.
- Gamma Flip — the level where aggregate gamma exposure changes sign. Enabling it shades the chart background either side of the level; this chart does not draw a labelled
GAMMA 0line, which only GEX Gaudio does. See Gamma Flip (Gamma 0). - Summary cards below the chart: spot price, last update, the expiration in use, total call GEX volume, total put GEX volume and the net GEX difference.
Controls
Section titled “Controls”The Chart Settings popover holds Show Levels, Gamma Flip, Price Trend and Net Positions. Outside it: Rotate chart, Reset Zoom, Screenshot and Fullscreen. Settings are stored as the page layout for that symbol.
Why traders use it
Section titled “Why traders use it”Because it reacts within the session. On short-dated expirations — 0DTE in particular — the gamma that matters for the next hour is largely the gamma being traded right now, and volume-based GEX is the only view that reflects it in time to be useful. Watching where the volume-driven gamma builds relative to spot is how you anticipate the areas where dealer hedging will intensify.
Read it against the Open-Interest view: when volume GEX builds on the same strikes that already carry Open Interest gamma, the effect compounds; when it builds somewhere new, the flip level is likely to move.
On futures
Section titled “On futures”It also works on futures with listed options, such as ES and NQ, with two differences from stocks and indices:
- Volume and open interest are only available for strikes near the price, about ±3% on ES. The header says so with the Vol/OI only within ±X% notice, which gives the covered band: a wider strike filter adds no data.
- Show Levels on ES and NQ draws the day’s market maker supports and resistances from the Gaudio Indicator, while the market is open or in pre-market. Other futures have no market maker levels.
Common mistakes
Section titled “Common mistakes”- Comparing it directly with the Open Interest version by magnitude. They measure different populations of contracts; compare their shapes and the location of the flip, not the absolute totals.
- Reading early-session volume GEX as representative. Volume accumulates through the day, so the profile is thin at the open by construction.
- Treating GEX as a directional forecast. It describes a hedging regime, not a prediction.
- Widening the strike filter on a futures contract and expecting more bars. Volume and open interest only arrive within the band the header notice gives: past it, the chart does not change.
Frequently asked questions
What does the GEX Volumes chart show?
Gamma exposure per strike computed on the option volume traded during the current session, with the call and put components separated, the Gamma Flip level, and summary cards for spot price, expiration, total call and put GEX volume and the net difference.
When should I use GEX Volumes instead of GEX Open Interest?
Use GEX Volumes when you care about what is happening now, especially on short-dated expirations such as 0DTE, because it reflects the gamma being created during the session. Use GEX Open Interest to frame the standing, accumulated positioning.
Why is the GEX Volumes profile almost empty early in the session?
Because volume accumulates from the open. Early in the day little has traded, so the profile is naturally thin and fills out as the session progresses.
Which plans include the GEX Volumes chart?
Premium and Ultra. It belongs to the Intraday feature group and is not available on the Free or Strategy plans.
Related pages
Section titled “Related pages”Ready to use Gaudio OTT?
Section titled “Ready to use Gaudio OTT?”Open your free account and put what you just read into practice.