

Fear & Greed
The Fear & Greed card shows the sentiment of the US market on a 0 to 100 scale, next to the Morning briefing at the top of the Dashboard.
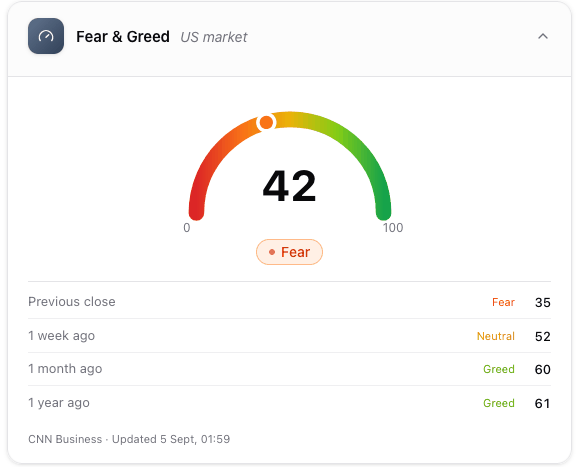
Fear & Greed: the current reading on the gauge, its rating, and where the index stood a week, a month and a year ago.
Where it is
Section titled “Where it is”Top right of the Dashboard, above Sector performance. It is available to every signed-in user, on every plan.
What the card shows
Section titled “What the card shows”- The gauge, from 0 to 100, with a marker on the current value and the value printed at the centre. The colour scale runs red on the left to green on the right.
- The rating of the current value, as a coloured badge.
- Four reference readings below: previous close, one week ago, one month ago, one year ago — each with its own value and rating.
- The source and update time at the bottom: CNN Business, with the time of the reading shown in your account timezone.
How to read it
Section titled “How to read it”The index summarises several market indicators into a single number. Low values mean investors are fearful, high values mean they are greedy:
| Value | Rating |
|---|---|
| Below 25 | Extreme fear |
| 25 to 44 | Fear |
| 45 to 55 | Neutral |
| 56 to 75 | Greed |
| Above 75 | Extreme greed |
The four historical readings are what makes the number usable: 42 today means one thing after a month at 60, and another after a week at 30. Read the direction before the level.
Why traders use it
Section titled “Why traders use it”Sentiment is a context indicator, not a signal. It tells you which side of the market is crowded — useful when you are deciding whether to sell premium into fear or to be careful about a rally everyone is already long. It pairs naturally with the volatility chart and ATM Vola, which show the same emotion priced into options.
How often it updates
Section titled “How often it updates”The index is recalculated several times a day by its source, not tick by tick. The card follows the dashboard’s 60-second refresh, but a new value only appears when the source publishes one — the update time at the bottom of the card always says which reading you are looking at.
If the source is momentarily unreachable, the card keeps showing the last good reading with its date, so a number on screen is never one you cannot date.
Collapsing it
Section titled “Collapsing it”Click the header to collapse the card; the choice is remembered by your browser. The Collapse all button in the Morning briefing header collapses or reopens the three top cards together.
Common mistakes
Section titled “Common mistakes”- Using it as an entry signal. It is a sentiment gauge, not a trade trigger: extreme fear can stay extreme for weeks.
- Reading the level without the history. The four readings below the gauge exist to give the number a direction.
- Expecting a real-time value. The index is recomputed a few times a day; the update time is stated on the card.
- Applying it outside the US. The index measures the US market, as the subtitle says.
Frequently asked questions
What is the Fear & Greed card on the Gaudio OTT dashboard?
It is the card showing the CNN Business Fear & Greed index for the US market on a 0 to 100 scale, with its rating and the readings from the previous close, one week, one month and one year ago.
How do I read the Fear & Greed values?
Below 25 is extreme fear, 25 to 44 fear, 45 to 55 neutral, 56 to 75 greed, above 75 extreme greed. Low values mean investors are fearful, high values mean they are greedy.
How often is the Fear & Greed index updated?
Several times a day, not in real time. The card shows the time of the reading at the bottom, in your account timezone, so you always know how fresh the value is.
Which plans include the Fear & Greed card?
All of them. It is shown to every signed-in user, including the Free plan.
Why is the card showing a reading from yesterday?
When the source is momentarily unreachable, the card keeps the last good reading rather than going blank. The update time at the bottom tells you which reading you are looking at.
Related pages
Section titled “Related pages”Ready to use Gaudio OTT?
Section titled “Ready to use Gaudio OTT?”Open your free account and put what you just read into practice.