

Dance Gaudio
Dance Gaudio shows where SPX 0DTE options are trading right now: the call and put volume of the last minutes on each strike, not the total since the open. As the session goes on the expected move shrinks, and the recent volume tells you more about where the market is working than the volume piled up in the morning.
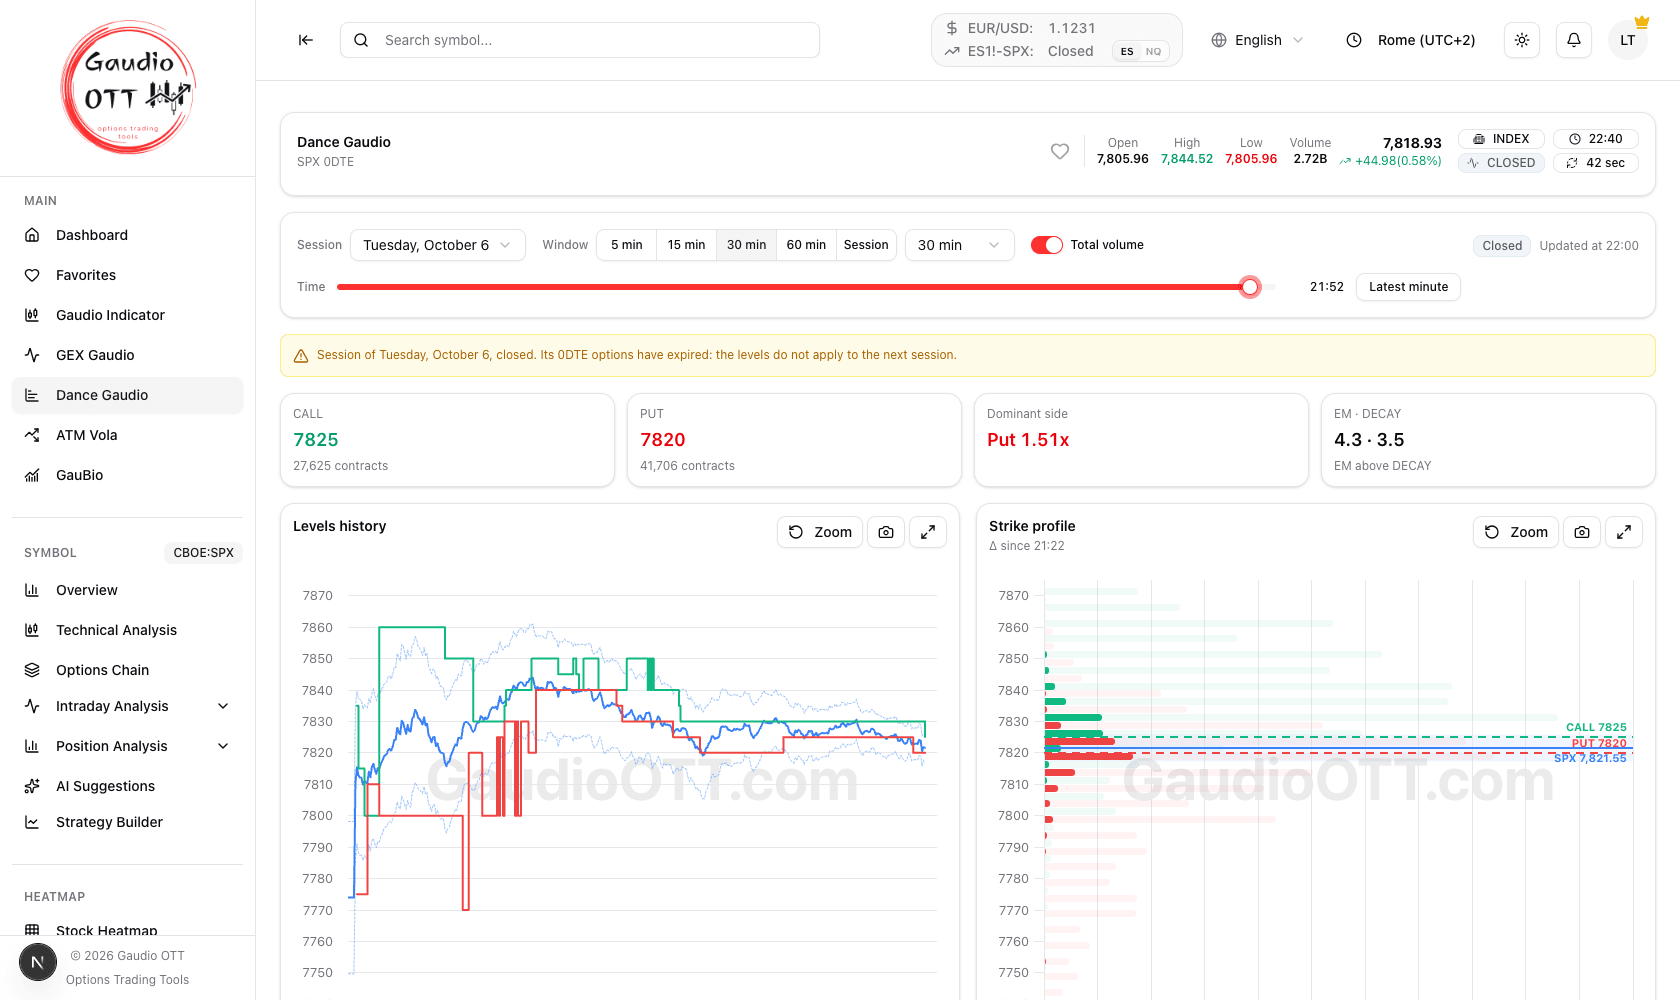
Dance Gaudio: the summary cards on top, EM and DECAY included; the levels history on the left, the strike profile of the chosen window on the right.
What it is for
Section titled “What it is for”Dance Gaudio is for choosing the strikes of SPX 0DTE structures, vertical spreads in particular. The CALL and PUT levels are the strikes where recent volume concentrates, the ones volume is moving towards: they are the reference for placing the legs of the spread.
- Your view decides the type of spread. Bullish or bearish, credit or debit: the tool does not pick the direction, it tells you where to place the legs once you have.
- The best levels sit inside the expected move. The expected move is how far options price SPX could move before the close: a level inside the band is a price the market considers within reach.
- The window follows the length of the trade. 30 and 60 minutes are the most used, but any window works: shorter for a quick trade, longer, or the whole Session, for one that has to last.
- It is used together with GEX Gaudio, which shows the SPX gamma levels: the two reads are looked at side by side.
It is not a trading signal: it is the starting point for building the spread, for example in the Strategy Builder.
Where it is
Section titled “Where it is”Side menu, Main → Dance Gaudio. Available on the Ultra plan only.
What the page shows
Section titled “What the page shows”The page works on SPX options expiring today (0DTE). The data is recorded every minute, from a few minutes before the US cash market opens until the close, so the page always shows the whole session up to the latest minute.
From top to bottom you find four summary cards, the controls, and three charts: the levels history and the strike profile side by side, with the EM and DECAY panel below. The levels history and the strike profile share the same price scale, so a strike sits at the same height in both.
Summary cards and controls
Section titled “Summary cards and controls”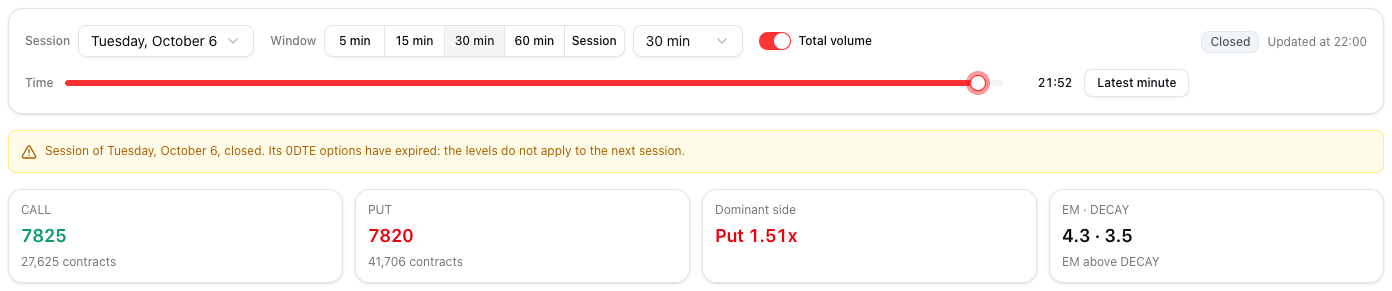
The summary of the chosen minute and the controls that decide what the charts count.
The four cards describe the minute you are looking at:
- CALL — the strike with the most call volume in the window, with the number of contracts.
- PUT — the strike with the most put volume in the window, with the number of contracts.
- Dominant side — which of the two levels carries more volume, and by how much: Call 1.4x means the CALL level traded 1.4 times the contracts of the PUT level. Even when the two are the same.
- EM · DECAY — the current expected move and its decay curve, in SPX points, with whether EM is above or below DECAY.
Hovering a card explains what it measures.
The controls:
- Session — the session to show. The last 30 days are kept.
- Window — how many minutes of volume to count: 5, 15, 30 or 60 minutes with the quick buttons, any value from 5 to 120 minutes in steps of 5 from the menu, or Session for everything since the open. The default is 30 minutes, and the page remembers your choice. The window applies to everything: cards, strike profile and the history of the levels.
- Total volume — adds the volume since the open behind the window’s bars, in a lighter shade, so you can see whether today’s trading is still where it was earlier or has moved. It changes only the picture, not the levels.
- Time — on a closed session, a slider moves the whole page to any minute of the day; Latest minute brings it back to the end.
While the session is live the page updates on its own every minute, and the header shows the SPX price with the countdown to the next update. A Live or Closed badge next to the controls tells you which of the two you are looking at.
The strike profile
Section titled “The strike profile”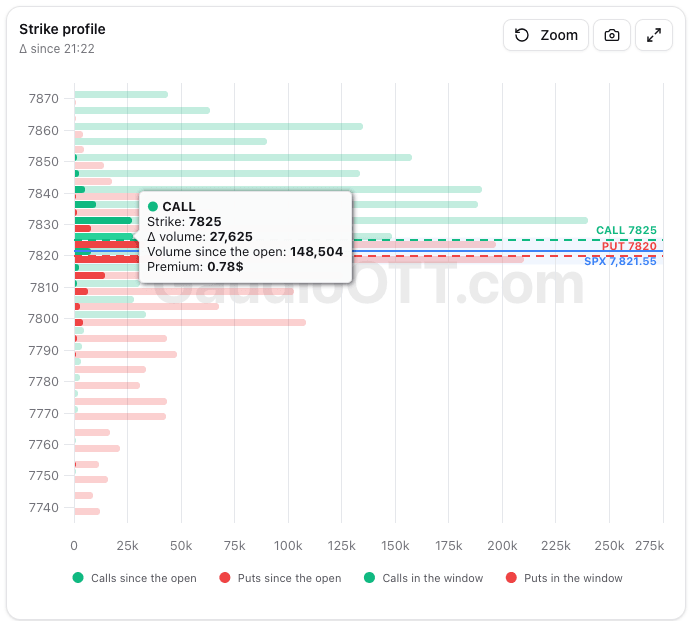
The strike profile: the volume of the window strike by strike, with the tooltip of one bar.
The strike profile is the heart of the page: it shows where the options are trading in the chosen window.
- The vertical axis is the price: one row per strike, every 5 points, within about 3% of the SPX price. It is the same scale as the levels history next to it.
- The bars are the contracts traded in the window: green for calls, red for puts. On each strike the call bar sits just above the put bar, so the two never cover each other.
- The lighter bars, when Total volume is on, are the contracts traded since the open on the same strike. A long dark bar inside a short light one is volume arriving now; a long light bar with a short dark one is a strike that was busy earlier and has gone quiet.
- Three labelled lines: the dashed green CALL line on the strike with the most call volume, the dashed red PUT line on the strike with the most put volume, and the blue SPX line at the current price.
- The light blue band around the SPX line is the expected move: how far, up and down, the options are pricing SPX can travel before the close.
- The subtitle says from when the window counts (Δ since 15:20), and warns when some minutes are missing.
- Hovering a bar shows the side, the strike, the volume in the window, the volume since the open and the option’s premium.
- The legend under the chart turns each series on and off.
What to look for: a CALL or PUT level close to the price and well above the other bars is a strike where the market is clearly working; volume spread evenly over many strikes says the market has no clear focus. Comparing the two levels with the band tells you whether the trading is happening inside the expected move or at its edges.
The levels history
Section titled “The levels history”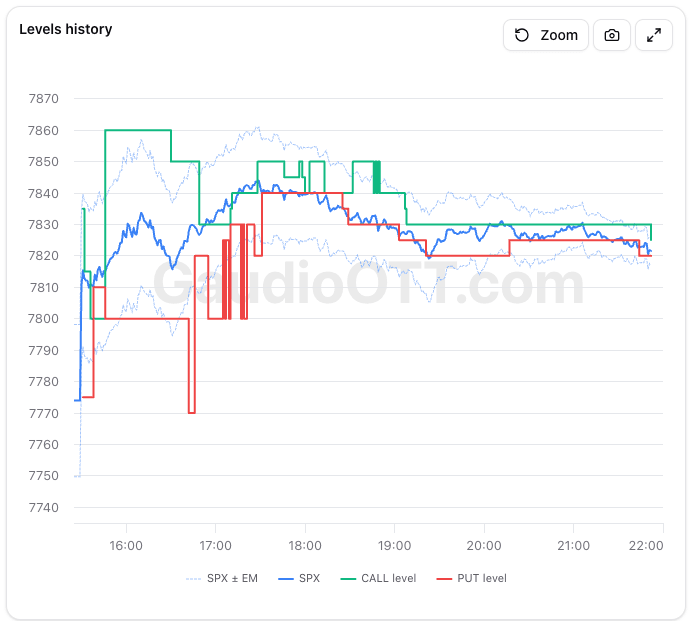
The levels history: where the CALL and PUT levels were, minute by minute, around the SPX price.
The levels history shows how the picture of the strike profile changed through the session.
- The horizontal axis is time, from a few minutes before the open to the close, in your time zone. The vertical axis is the price, aligned with the strike profile.
- The blue line is the SPX price.
- The two light blue dashed lines are the price plus and minus the expected move, minute by minute. They follow the price and get closer together as the close approaches, because there is less time left for the price to move.
- The green step line is the CALL level and the red step line the PUT level, minute by minute. Each point is computed with the same window you chose, so changing the window changes their history too.
- Hovering shows all the values of that minute together.
What to look for: a level that stays flat for a long stretch is a strike the market keeps returning to; frequent jumps mean the volume is moving from strike to strike. Watching where the price sits between the green and the red line, and how close the two get in the last part of the session, is the main use of this chart.
The EM and DECAY panel
Section titled “The EM and DECAY panel”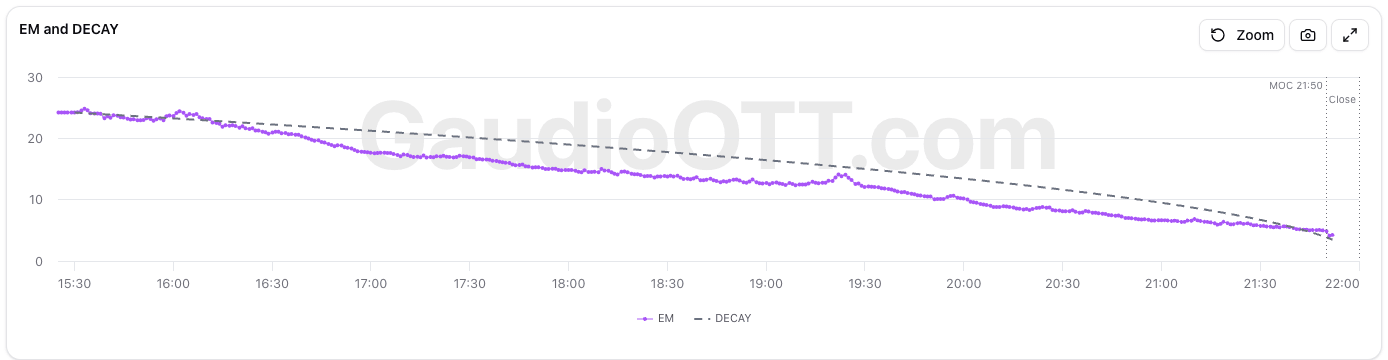
EM and DECAY: the expected move against the path that time alone would give it.
- EM (purple line with dots) is the move, in SPX points, that the options are pricing from that minute to the close. It is naturally a bit nervous, and it falls through the day because there is less and less time left.
- DECAY (grey dashed line) is the path the expected move of the open would follow if only time passed. It is smooth and always falls.
- The two vertical dotted lines mark the MOC, ten minutes before the close (15:50 New York on a normal day), and the Close, both at your local time.
- Hovering shows EM and DECAY of that minute.
How to read it:
- EM above DECAY — the market is pricing a larger move than time alone would explain.
- EM below DECAY — volatility is compressing faster than time alone.
- The distance between the two lines matters more than the single value: a gap that keeps widening says the market is changing its mind about how much movement is left in the day.
Zoom, screenshot and fullscreen
Section titled “Zoom, screenshot and fullscreen”Drag across a chart, or use the mouse wheel over it, to zoom. Zooming the prices on the strike profile zooms the levels history too; zooming the time on the levels history zooms the EM and DECAY panel too. Each chart has the usual tools at the top right: Zoom to go back to the full view, a camera for a screenshot, and fullscreen.
Before the open and missing minutes
Section titled “Before the open and missing minutes”Before the US cash market opens, the page shows the last session and says when today’s data will appear, in your time zone. In the first minutes before the open a notice reminds you that the window’s volume builds up from the 09:30 New York open.
If some minutes were not recorded, the subtitle of the strike profile says so (Missing data with the times), so you know the window covers less than it should.
How to use it
Section titled “How to use it”- For a vertical spread: pick the window according to how long the trade should last, take the CALL and PUT levels that fall inside the expected move, compare them with GEX Gaudio and place the legs according to your view.
- Pick a short window (15-30 minutes) to see where the market is working now, and a longer one, or Session, for the context of the day.
- Watch how the CALL and PUT levels move in the levels history: levels that hold for many minutes say more than a level that appears for a single minute.
- Read the dominant side together with the price: a clear prevalence of one side on a level close to the price is different from scattered volume far from it.
- In the last part of the session, after the MOC line, the expected move is small: the two levels are often only a few points apart, and the profile shows on which side the volume is concentrating.
Common mistakes
Section titled “Common mistakes”- Reading volume as positioning. Dance Gaudio counts the contracts traded, not whether they were bought or sold, nor the open interest. A level is where trading is happening, not a guaranteed support or resistance.
- Comparing levels of different sessions. The 0DTE options of a closed session have expired: its levels do not apply to the next day.
- Comparing windows of different length. A 60-minute window naturally shows more contracts than a 15-minute one; compare levels, not raw counts.
- Treating a level outside the expected move like one inside it. Outside the band is a price options consider less reachable before the close: for the legs of a spread, the levels inside it count more.
- Expecting other symbols or expirations. Dance Gaudio covers SPX options expiring today only.
Frequently asked questions
What does Dance Gaudio show in Gaudio OTT?
The volume of SPX options expiring today traded in the last minutes, strike by strike, with the CALL level (most call volume), the PUT level (most put volume), the dominant side, the expected move and its decay.
How do I use Dance Gaudio for a 0DTE vertical spread?
Decide your view first: bullish or bearish, credit or debit. Then pick the window according to how long the trade should last (30 and 60 minutes are the most used), look at the CALL and PUT levels that fall inside the expected move and compare them with GEX Gaudio: they are the reference for placing the legs of the spread. It is not a trading signal.
Why the volume of the last minutes and not the total of the day?
Because the expected move shrinks as the session goes on: the volume traded recently says more about where the market is working now than the volume accumulated since the morning. The Total volume switch shows both together.
How do I choose the window?
With the quick buttons (5, 15, 30, 60 minutes and Session) or from the menu, from 5 to 120 minutes in steps of 5. The default is 30 minutes and the page remembers your choice.
What do EM and DECAY mean?
EM is the move in SPX points that the options are pricing until the close. DECAY is the path the expected move of the open would follow with time alone. EM above DECAY means the market is pricing more movement than time alone would explain; below means volatility is compressing.
What does the page show before the market opens?
The last session, with a notice that says when today data will appear, in your time zone.
Can I review a past session minute by minute?
Yes. Choose the session and use the Time slider to move the whole page to any minute of that day. The last 30 days are kept.
Which plans include Dance Gaudio?
Ultra only.
Related pages
Section titled “Related pages”Ready to use Gaudio OTT?
Section titled “Ready to use Gaudio OTT?”Open your free account and put what you just read into practice.