Technical Analysis
Technical Analysis is the price chart of the active symbol: a full-height interactive chart with indicators, drawing tools and every timeframe, next to the options analyses that make up the rest of the Symbol section.
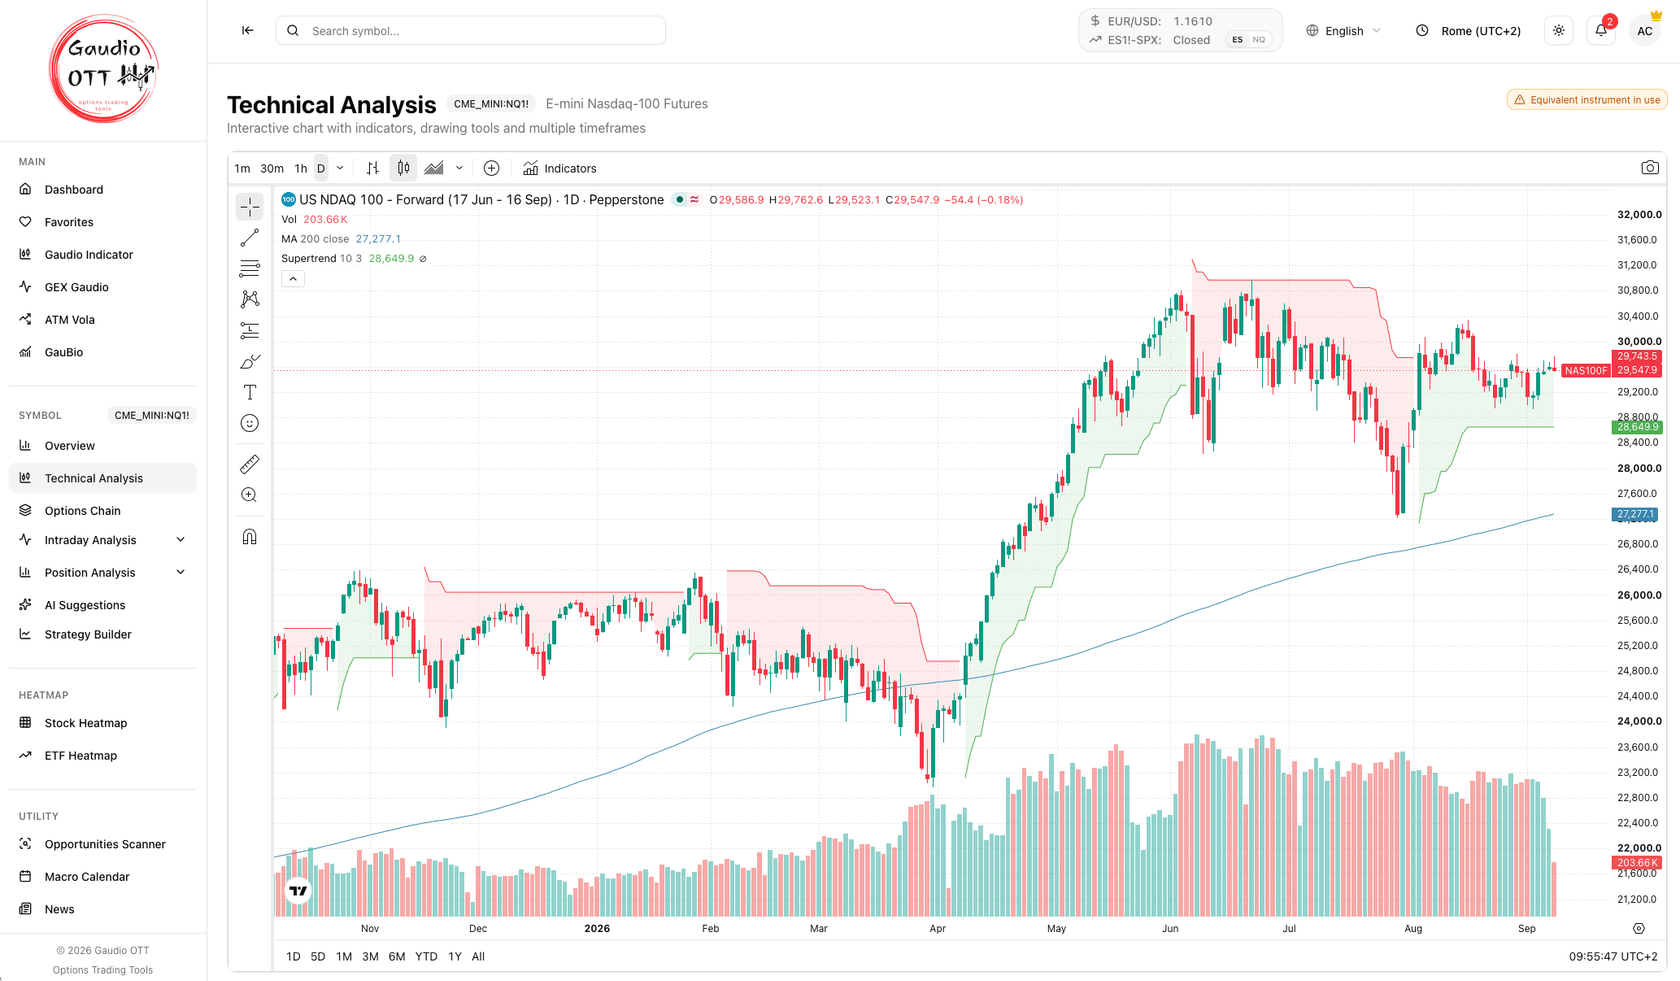
Technical Analysis on the E-mini Nasdaq-100 future: timeframe bar and Indicators button at the top, drawing toolbar on the left, volume, MA 200 and SuperTrend already on the chart.
Where it is
Section titled “Where it is”Side menu, Symbol → Technical Analysis, immediately below Overview. It is available on all plans, including Free, and only needs a verified email like the rest of the dashboard.
What is already on the chart
Section titled “What is already on the chart”The chart opens on the daily timeframe with candlesticks and three things already loaded:
- Volume, as bars at the bottom of the price pane;
- MA 200, the 200-period simple moving average on the close;
- SuperTrend, the trend band that colours the background green or red.
The legend at the top left always names the instrument actually being displayed, its timeframe and its data source, followed by open, high, low and close of the selected bar and by the value of each indicator.
The toolbars
Section titled “The toolbars”- Timeframes — the quick buttons 1m, 30m, 1h, D, with every other interval in the dropdown next to them.
- Chart type — candles, bars, line, area and the other styles, from the dropdown in the top bar.
- Indicators — opens the full indicator library: add what you need on top of the three preloaded ones, and remove any of them from the legend.
- Drawing toolbar — the vertical bar on the left: trend lines, horizontal levels, Fibonacci, channels, text, measuring tool and zoom.
- Date ranges — the strip along the bottom: 1D, 5D, 1M, 3M, 6M, YTD, 1Y, All.
- Snapshot — the camera icon at the top right saves the chart as an image.
It follows the app
Section titled “It follows the app”The chart is built from your own settings: language, timezone (the clock at the bottom right of the chart is the one you selected in the top bar) and light or dark theme all come from the app.
The symbol comes from the app too, and for that reason it cannot be changed from inside the chart: the chart always shows the active symbol, so it can never drift away from the side menu and from the other analyses. Change instrument with the symbol search in the top bar.
The chart streams on its own and is not governed by the 60-second refresh used by the rest of the platform. See Is the data real time?
Indicators and drawings are not saved
Section titled “Indicators and drawings are not saved”Anything you add — an extra indicator, a trend line, an annotation — lives in the chart for as long as you leave it open. There is no TradingView account behind it, so nothing is stored: leaving the page, or changing symbol, theme, language or timezone, reloads the chart with the three preloaded indicators and no drawings.
If a drawing matters, use the camera icon and keep the image.
When the chart shows an equivalent instrument
Section titled “When the chart shows an equivalent instrument”The chart is provided anonymously, which means it has no rights on CME futures, on the US cash indices or on the cash VIX. Rather than leaving those symbols without a chart, Gaudio OTT points them at the closest freely available instrument, and says so with a badge at the top right of the page. Hovering the badge shows the name of the instrument in use, which is also visible in the chart legend.
There are two wordings, because the risk is not the same:
- Same contract in use — the very same contract you opened, listed by another broker. Only the broker’s spread differs.
- Equivalent instrument in use — a different instrument standing in for the one you asked for. The shape of the move is the same, the levels are not.
Each substitution was verified one instrument at a time, and where a future is involved the preference goes to an instrument that quotes the quarterly contract rather than the cash index, so the levels stay as close as possible to the ones you actually trade.
No badge means no substitution: the chart is showing exactly the instrument you opened. That is the case for US stocks and ETFs and for European stocks and indices — Eni, SAP, DAX, Euro Stoxx 50 and the rest.
Instruments left without a chart
Section titled “Instruments left without a chart”Some instruments have no verified equivalent — Treasury futures are the case in point: the available substitutes either do not exist or quote a yield instead of a price, which would draw a chart that rises when the bond falls. For those, the page deliberately shows TradingView’s own notice in place of the chart rather than a misleading one.
Why traders use it
Section titled “Why traders use it”The rest of the Symbol section explains where the options sit; this page explains where the price is. Reading a GEX level or a strike concentration without knowing whether price is above or below its 200-period average, or which side of the trend band it sits on, is how a level gets traded in the wrong direction. Having the chart inside the platform also removes the step of opening a second tool and re-selecting the same instrument by hand.
How to use it inside Gaudio OTT
Section titled “How to use it inside Gaudio OTT”Open Technical Analysis right after the Overview, before the options analyses: frame the trend and mark the levels that matter, then move to the Options Chain, the intraday analyses and the position studies with those levels in mind. When you build the trade in the Strategy Builder, the strikes you choose are the ones the chart just justified.
Common mistakes
Section titled “Common mistakes”- Reading the levels of an equivalent instrument as levels of the one you opened. With the Equivalent instrument in use badge on screen, the shape is comparable but the prices are not: never place an order off those numbers.
- Expecting drawings to still be there tomorrow. Nothing is saved. Take a snapshot instead.
- Looking for the symbol search inside the chart. It is disabled on purpose: change symbol from the top bar.
- Treating it as an options page. Volume here is the volume of the underlying instrument, not options volume — for that, see Intraday volumes.
Frequently asked questions
What does the Gaudio OTT Technical Analysis page show?
A full-height interactive chart of the active symbol, opening on the daily timeframe with candlesticks, volume, a 200-period simple moving average and SuperTrend already loaded, plus a drawing toolbar, the full indicator library, every timeframe and date range, and a snapshot button.
Which plans include Technical Analysis?
All of them, including Free. Like the rest of the dashboard it only requires a verified email address.
Which indicators are already on the chart?
Volume, the 200-period simple moving average on the close, and SuperTrend. You can add any other indicator from the Indicators button and remove the preloaded ones from the chart legend.
Are my indicators and drawings saved?
No. They last as long as the page stays open. Leaving the page, or changing symbol, theme, language or timezone, reloads the chart with the three preloaded indicators and no drawings. Use the camera icon to keep an image of your work.
Why does the chart sometimes show a different instrument from the one I opened?
The chart is provided anonymously and has no rights on CME futures, on the US cash indices or on the cash VIX. Instead of leaving those symbols without a chart, Gaudio OTT shows the closest freely available instrument and declares it with a badge: "Same contract in use" when it is the same contract listed by another broker, "Equivalent instrument in use" when it is a different instrument, whose levels do not coincide.
Why can I not change symbol from inside the chart?
Because the chart follows the active symbol of the platform. Searching inside the chart would desynchronise it from the side menu and from the other analyses of the Symbol section. Change instrument with the symbol search in the top bar.
Why do some instruments show a notice instead of a chart?
Because no equivalent free instrument has been verified for them: Treasury futures are the main case, where the available substitutes either do not exist or quote a yield rather than a price. Showing the notice is deliberate, because a chart moving the opposite way to the instrument would be worse than no chart.
Related pages
Section titled “Related pages”Ready to use Gaudio OTT?
Section titled “Ready to use Gaudio OTT?”Open your free account and put what you just read into practice.