

Expected Move
Expected Move shows how far the options market expects the price to move by each expiration. For every listed expiration of the active symbol you get the expected move in points and in percent, and the price range it implies, drawn as a cone that opens from today’s price over the price chart.
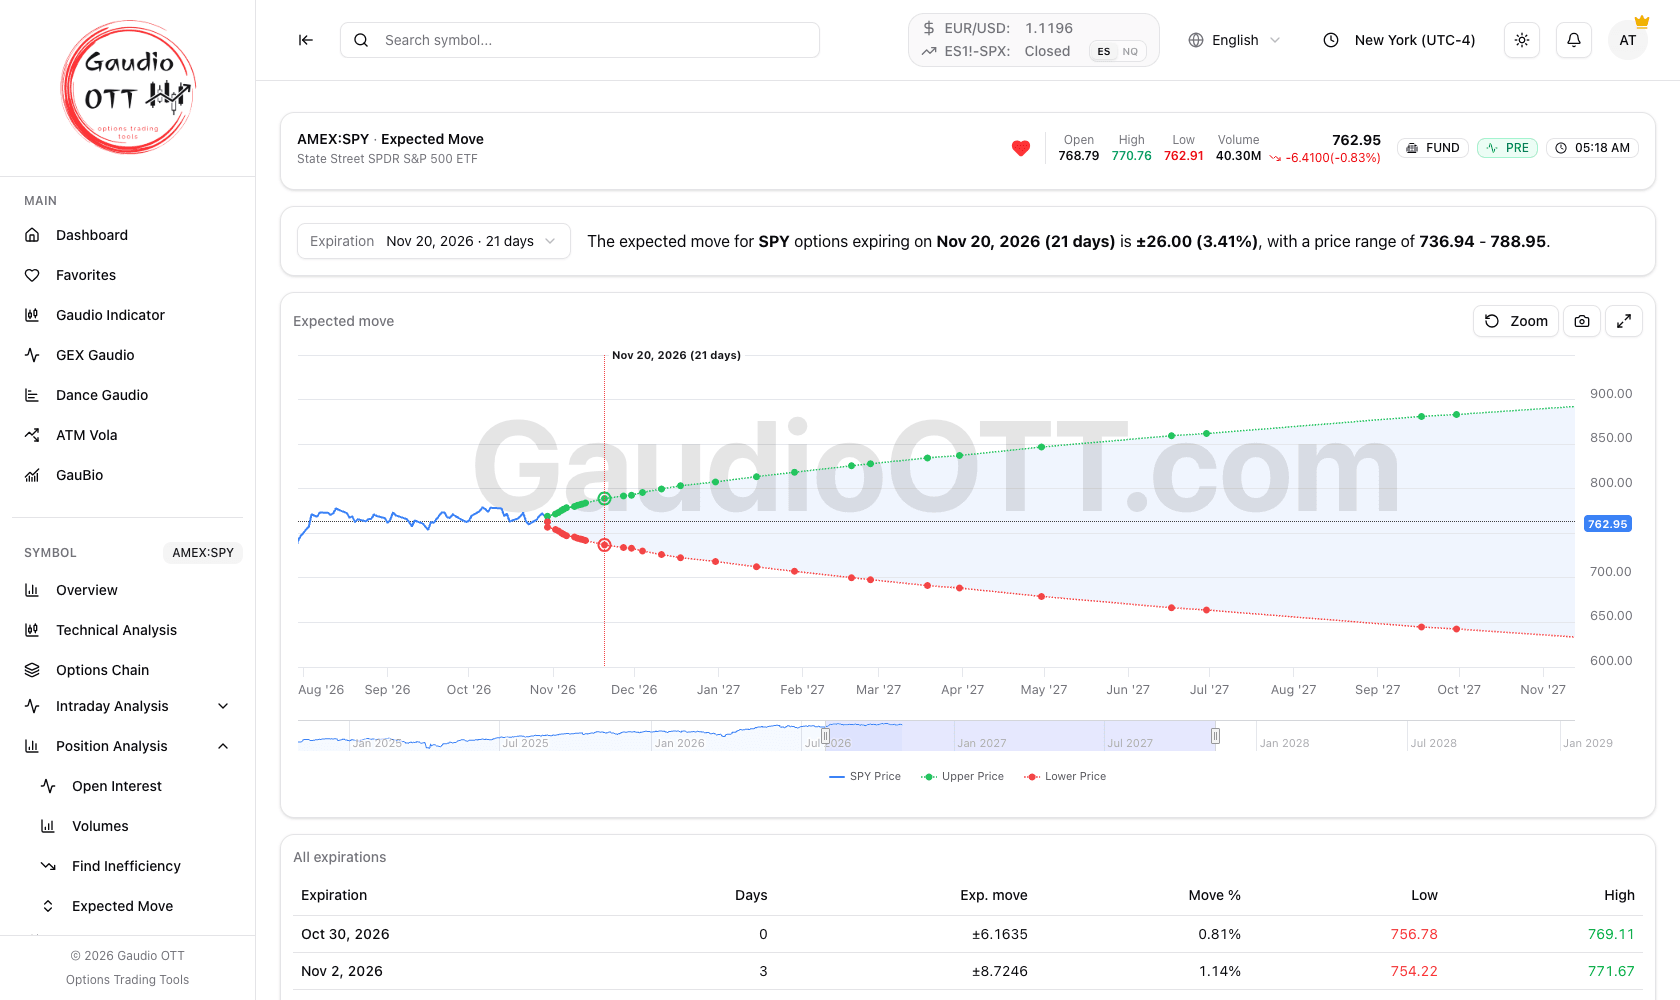
The blue line is the price history; from today’s price the green and red dotted lines mark the upper and lower end of the expected range on each expiration.
Where it is
Section titled “Where it is”Side menu, Symbol → Position Analysis → Expected Move. It refers to the active symbol. Available on the Premium and Ultra plans.
It works on every symbol with listed options: US stocks, ETFs and indices, futures such as ES and NQ, and European underlyings with options on Eurex or IDEM. For those the values come from the end-of-day settlement prices, and a note under the sentence says which day they refer to.
What the expected move means
Section titled “What the expected move means”The expected move is a range of one standard deviation: the options market prices in roughly a 68% probability that on the expiration date the price ends inside it. It is read straight from option prices, so it rises when options get more expensive and shrinks when they get cheaper.
The range is centred on the current price shown in the header: Low is the price minus the expected move, High the price plus it.
How to read the page
Section titled “How to read the page”Expiration selector and sentence. The bar above the chart holds the Expiration selector and one sentence with the reading for that expiration: the expected move in points and in percent, the days left, and the price range. The nearest expiration is selected when the page opens.
The chart.
- Price — the blue line, the daily closes up to today.
- Upper Price and Lower Price — the green and red dotted lines. They start from today’s price and have one point per expiration; the shaded area between them is the expected range.
- A dotted horizontal line marks the current price, with its value in a blue badge on the price axis.
- A red dotted vertical line marks the selected expiration, labelled with its date and the days left. The two points of that expiration are circled.
Hover over a point on the green or red line to see its expiration, the expected move and both ends of the range. Click a point to select that expiration.
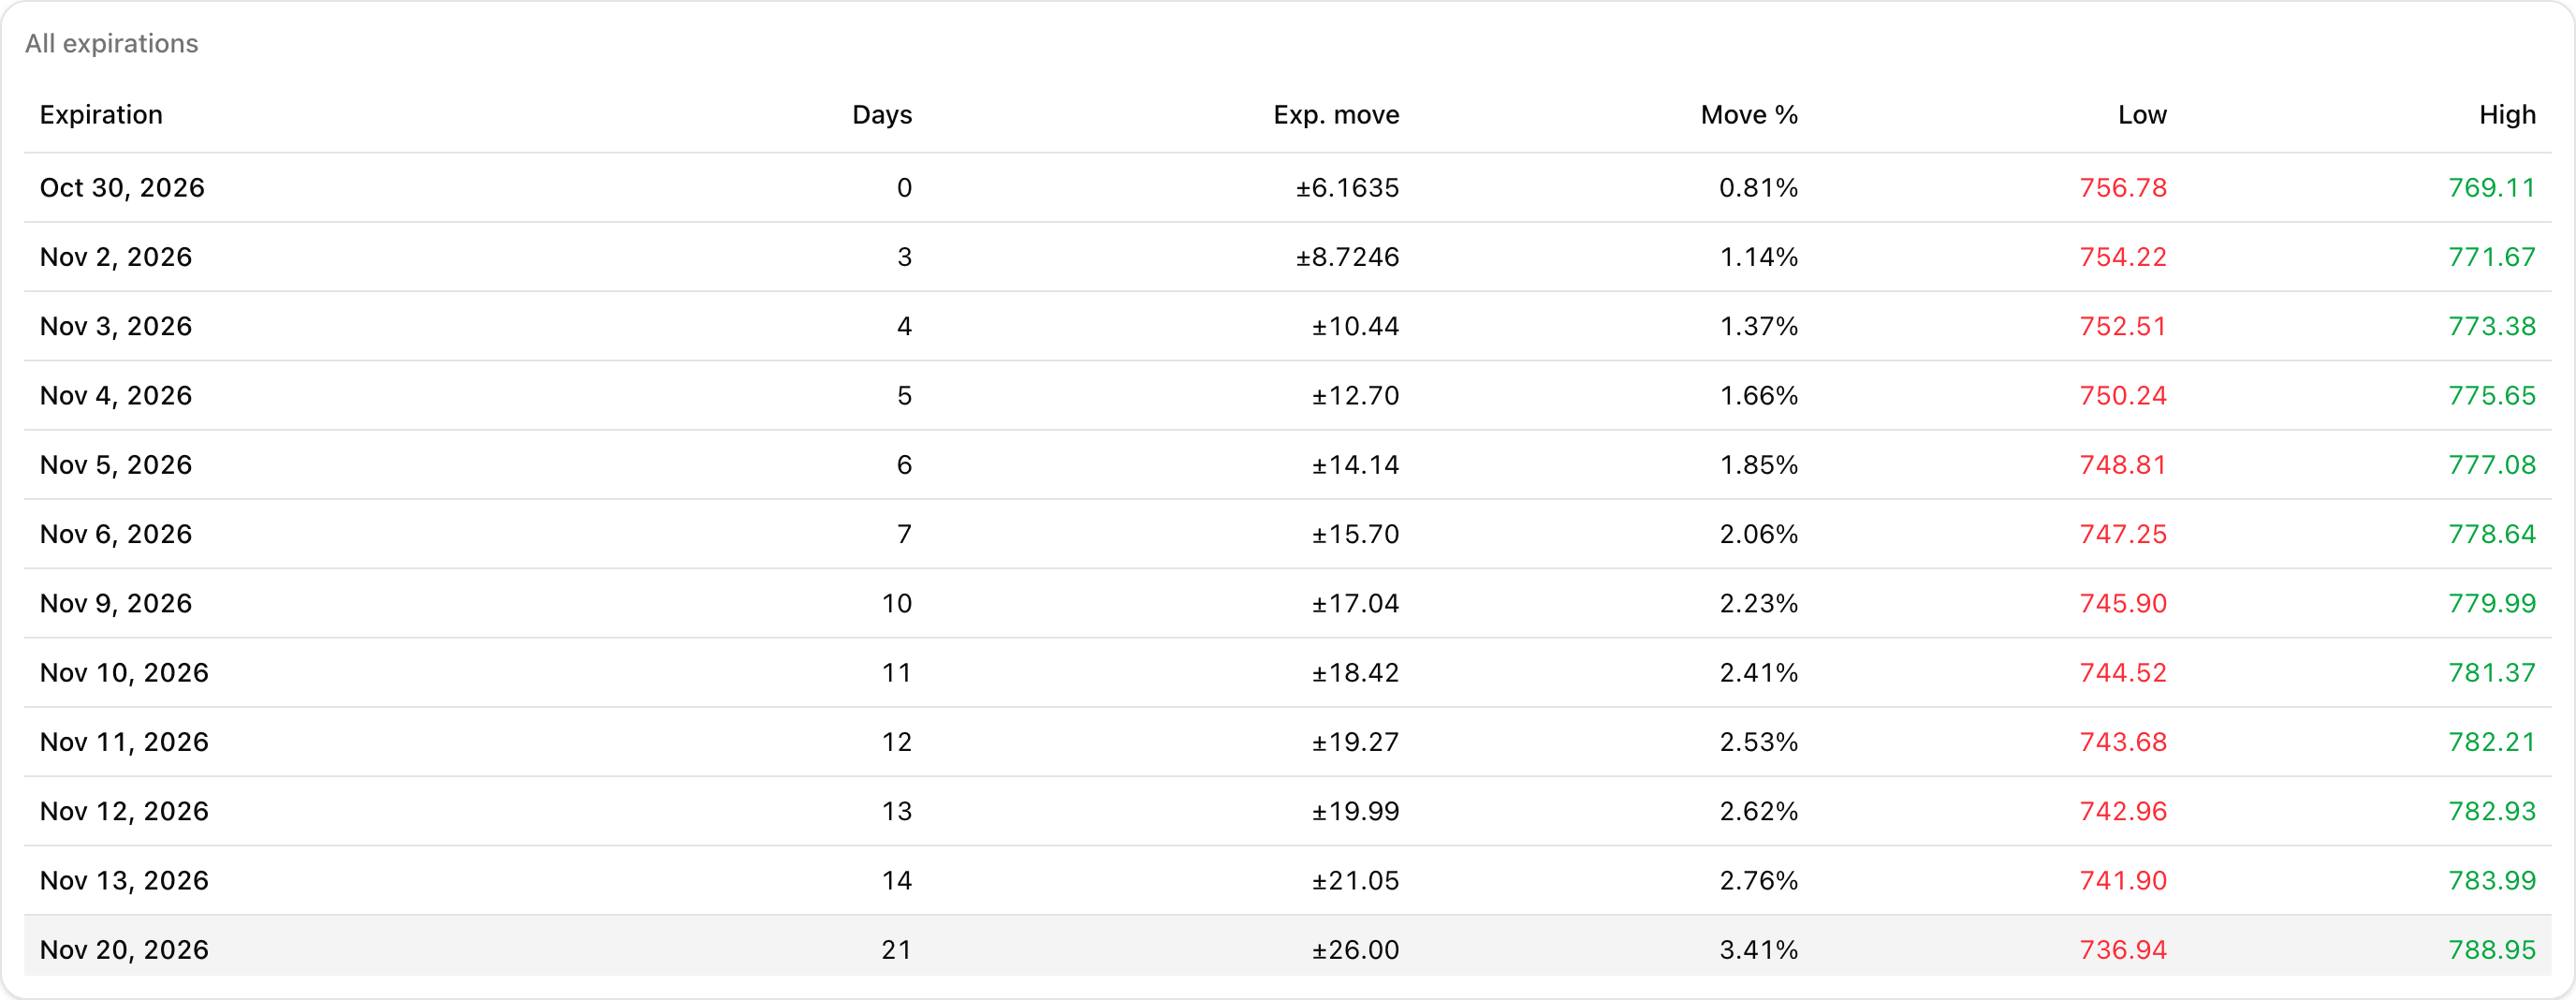
The table. Under the chart, All expirations lists every expiration with Days, Exp. move, Move %, Low and High. Click a row to select that expiration on the chart and in the sentence. On a phone the days and the percentage sit under the date.
The calculation runs over every expiration when the page opens, so the first load takes a few seconds on symbols with many expirations. If some expiration has no usable option prices it is left out, and a note says how many.
Chart controls
Section titled “Chart controls”- Mouse wheel zooms the time axis, dragging moves it; on touch screens pinch to zoom.
- The chart opens on the last three months of prices and the expirations within one year. The longest expirations, two or three years out, are one zoom away.
- Zoom brings the chart back to that starting view.
- The camera button saves the chart as a PNG; the full-screen button opens it on its own.
- On desktop, the navigator bar under the chart shows the whole range and lets you move the visible window.
Why traders use it
Section titled “Why traders use it”The expected move turns an options chain into one number per expiration: how wide the market thinks the next days or months can be. It is a quick check before choosing strikes — a short strike inside the expected range is in the zone the market considers likely to be touched, one outside it is not — and a way to see whether an event, such as earnings, is priced in: the expiration right after it shows a jump in the cone.
Common mistakes
Section titled “Common mistakes”- Reading the range as a limit. One standard deviation leaves roughly one chance in three that the price ends outside it.
- Comparing points across symbols. Points depend on the price level; compare Move % instead.
- Treating end-of-day values as live on Eurex and IDEM symbols. They refer to the settlement day shown in the note, and do not change during the session.
- Expecting the cone to be smooth. An expiration that carries an event costs more and sticks out: that is information, not noise.
Frequently asked questions
What does Expected Move show in Gaudio OTT?
For every option expiration of the active symbol it shows the expected move in points and percent and the price range it implies, drawn as a cone over the price chart, plus a table with all expirations.
What probability does the expected range carry?
It is a one standard deviation range: the options market prices in roughly a 68% probability that the price ends inside it on the expiration date.
Which plans include Expected Move?
Premium and Ultra.
Does Expected Move work on futures and European stocks?
Yes. It works on US stocks, ETFs and indices, on futures such as ES and NQ, and on underlyings with options on Eurex or IDEM, where the values come from the end-of-day settlement prices.
How do I choose the expiration?
With the Expiration selector above the chart, by clicking a point on the green or red line, or by clicking a row of the All expirations table.
Why is an expiration missing from the list?
Its options had no usable prices when the page loaded, so no expected move could be read. A note under the sentence says how many expirations were left out.
Related pages
Section titled “Related pages”Ready to use Gaudio OTT?
Section titled “Ready to use Gaudio OTT?”Open your free account and put what you just read into practice.