
Quick mode
Quick mode is the second way to build a strategy in the Strategy Builder: you pick the expiration on a strip, drag the legs along a strike ruler and watch the payoff update as you move them. It works on the same data and with the same calculations as Advanced mode — only the interface changes, and you can switch between the two at any time.
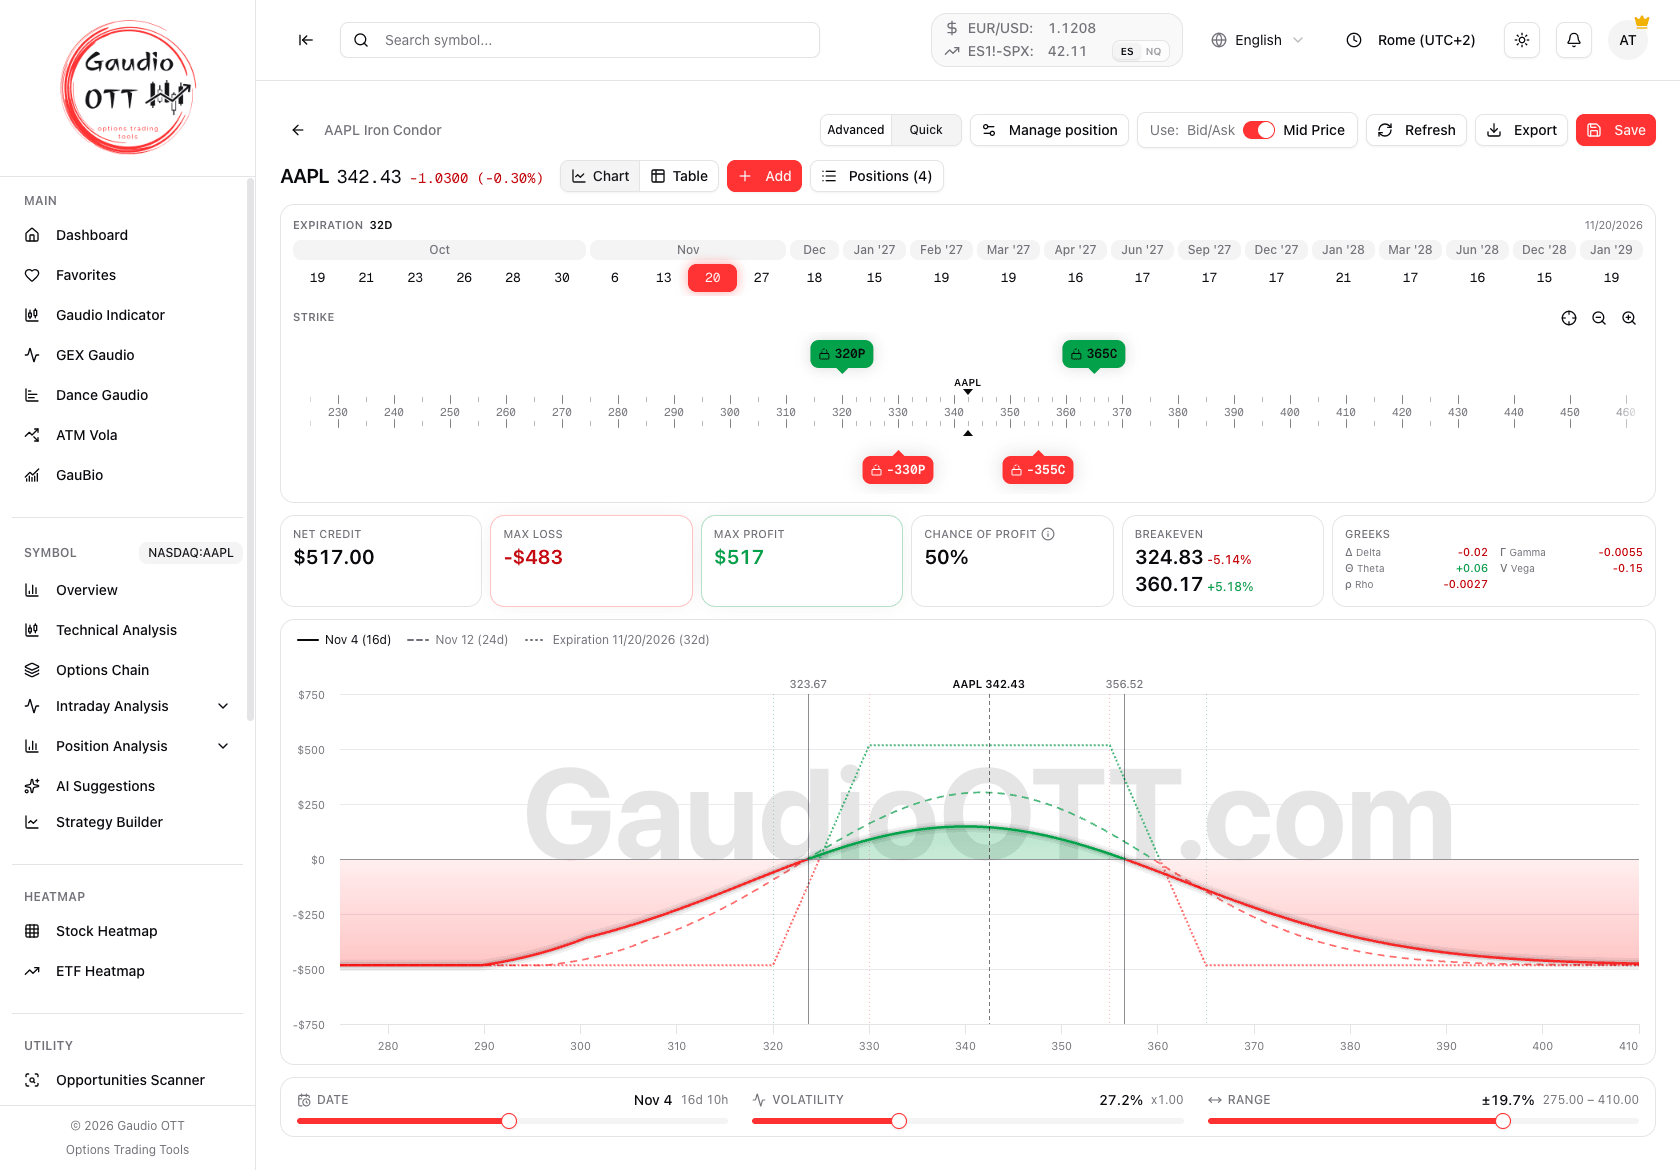
An iron condor on AAPL in Quick mode: the expiration strip and the strike ruler at the top, the metrics bar, the payoff chart with its three curves and the sliders underneath.
What Quick mode is for
Section titled “What Quick mode is for”- Trying an idea in seconds — start from a quick strategy and adjust it, without going through the chain row by row.
- Moving strikes and seeing the payoff right away — every leg is a pill on the ruler, and the chart follows it.
- Reading a structure at a glance — net debit or credit, max loss, max profit, chance of profit and breakevens are always on screen.
When you need the full options chain with greeks and strike filters, or you want to manage a position that is already on — closing legs, adding to them, the trade history — that is Advanced mode. The numbers are identical in the two modes.
Available on the Strategy and Ultra plans, like the rest of the Strategy Builder.
The whole flow, from New Strategy to a saved strategy
Section titled “The whole flow, from New Strategy to a saved strategy”-
Open the Strategy Builder from the side menu, under Symbol, on the symbol you want to work on. The list of saved strategies opens.
-
Click New Strategy. A window asks How do you want to build the strategy?, with two tiles: Quick and Advanced.
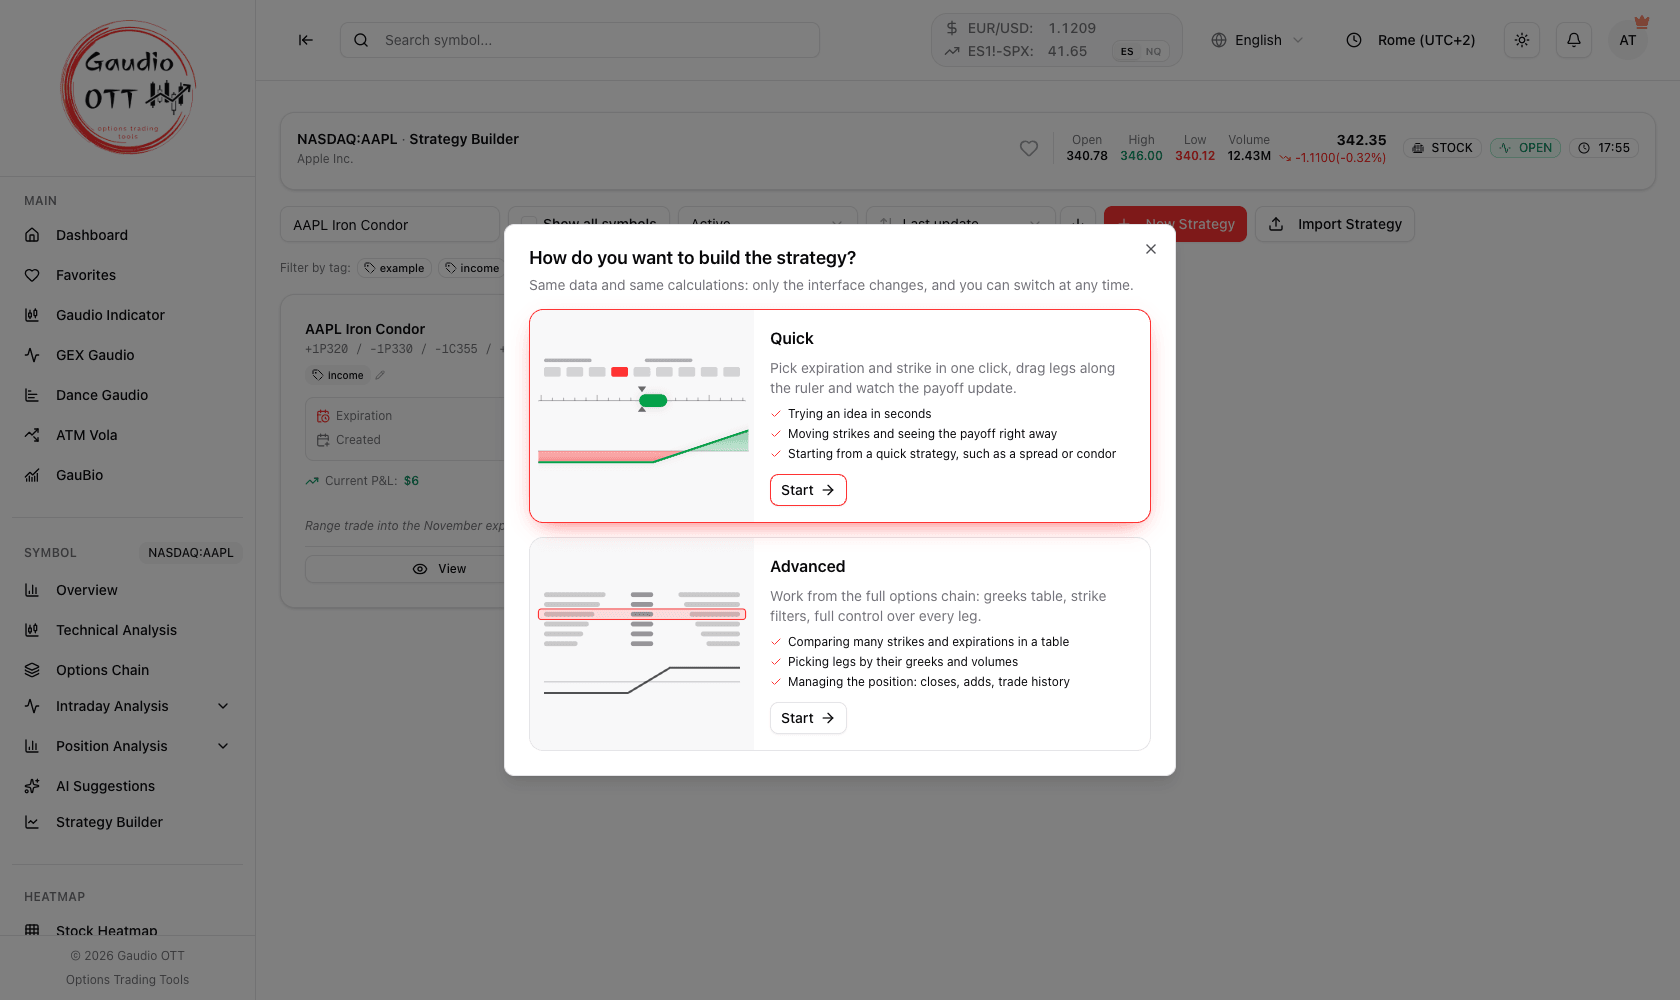
Each tile says what the mode is for and what it is best at. Hovering a tile highlights it; the one you chose last time is marked Last used.
-
Choose Quick and click Start. With the keyboard, the arrow keys move between the tiles, Enter confirms and Esc closes the window without opening anything.
-
Pick the expiration on the strip at the top. The builder opens on a default one; a quick strategy is always placed on the expiration selected there.
-
Pick a strategy from the gallery, or build the legs yourself with Add. The strategy appears on the ruler at the money, and the metrics, the chart and the sliders take the place of the gallery.
-
Adjust it: drag the pills to the strikes you want, open a leg to change quantity or price, use Expiration on a single leg for a calendar or a diagonal.
-
Read the result: the metrics bar, the payoff with its three curves and, with Table, the P&L by price and date.
-
Click Save, give the strategy a name (and if you like notes, tags and costs) and confirm. The page stays on the strategy, now saved: its legs carry a lock and Export appears.
-
Back in the list, the card carries the Quick label. View and the pencil reopen it in Quick mode.
The header holds the controls of the whole page:
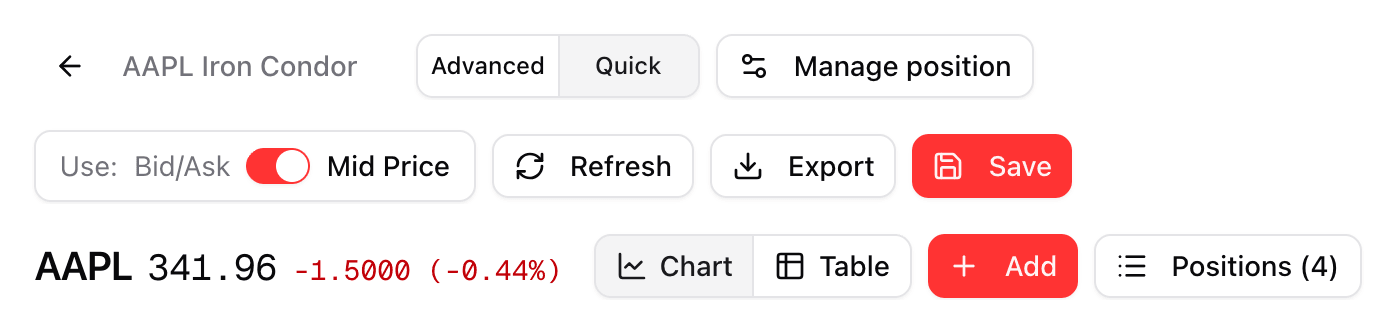
The header in three pieces. The first row starts with the strategy name, the Advanced | Quick switch and Manage position (on a saved strategy) and ends, on the right, with Use: Bid/Ask — Mid Price, Refresh, Export and Save. The second row holds the symbol with its price, Chart | Table, Add and Positions.
Other ways in
Section titled “Other ways in”The same choice opens when you send a strategy to the builder from the Opportunities Scanner or from AI Suggestions: the legs arrive in whichever mode you choose, ready to adjust, and the gallery is skipped.
Switching mode
Section titled “Switching mode”The Advanced | Quick switch in the header moves to the other mode at any time:
- on a strategy not saved yet, the legs come with you to the other mode, as they are;
- on a saved strategy it opens the same strategy in the other mode, and from then on the strategy opens there. If there are changes you have not saved, you are asked first.
Starting from a strategy
Section titled “Starting from a strategy”A new strategy in Quick mode opens on the gallery Start from a strategy: the same 58 predefined strategies as Advanced mode, each with a small drawing of its payoff.
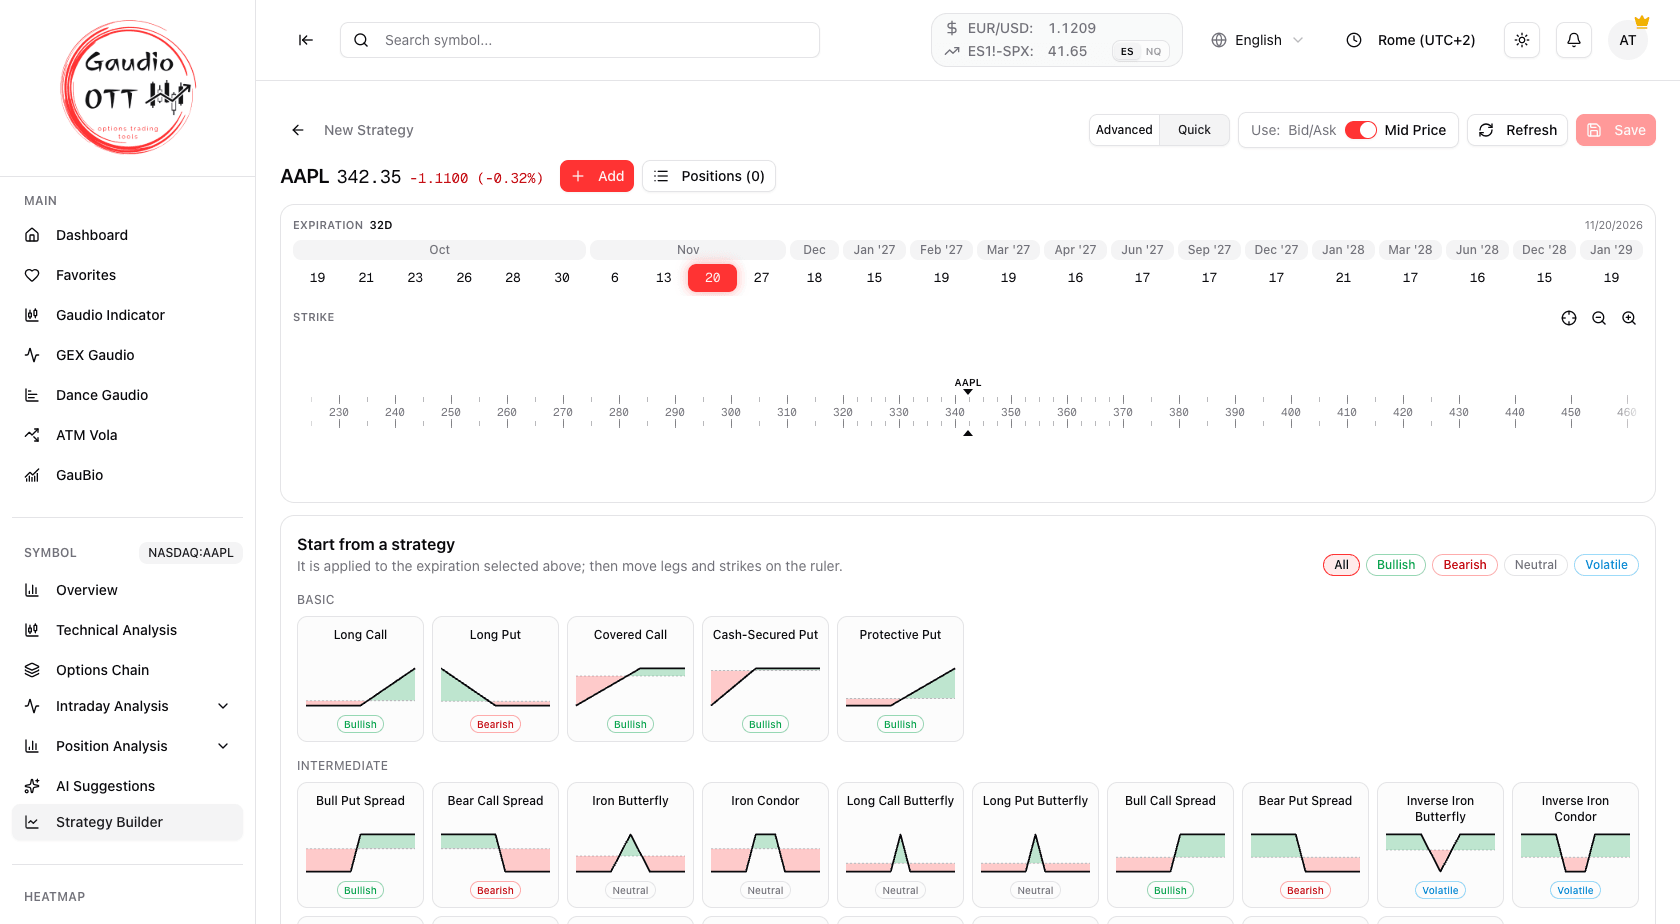
The gallery: outlook filters at the top, then the strategies by level, each with the shape of its payoff.
- The filters All, Bullish, Bearish, Neutral and Volatile narrow the gallery to the strategies with that outlook; each card carries its outlook as a badge.
- Basic and Intermediate are open; Advanced and Expert are behind Show 34 more. With a filter on, every level is shown.
- Hovering a card shows its description. A click applies the strategy on the expiration selected in the strip above, with strikes at the money.
Once the strategy has legs, the gallery gives way to the metrics, the chart and the sliders. Remove every leg and it comes back.
The expiration strip and the strike ruler
Section titled “The expiration strip and the strike ruler”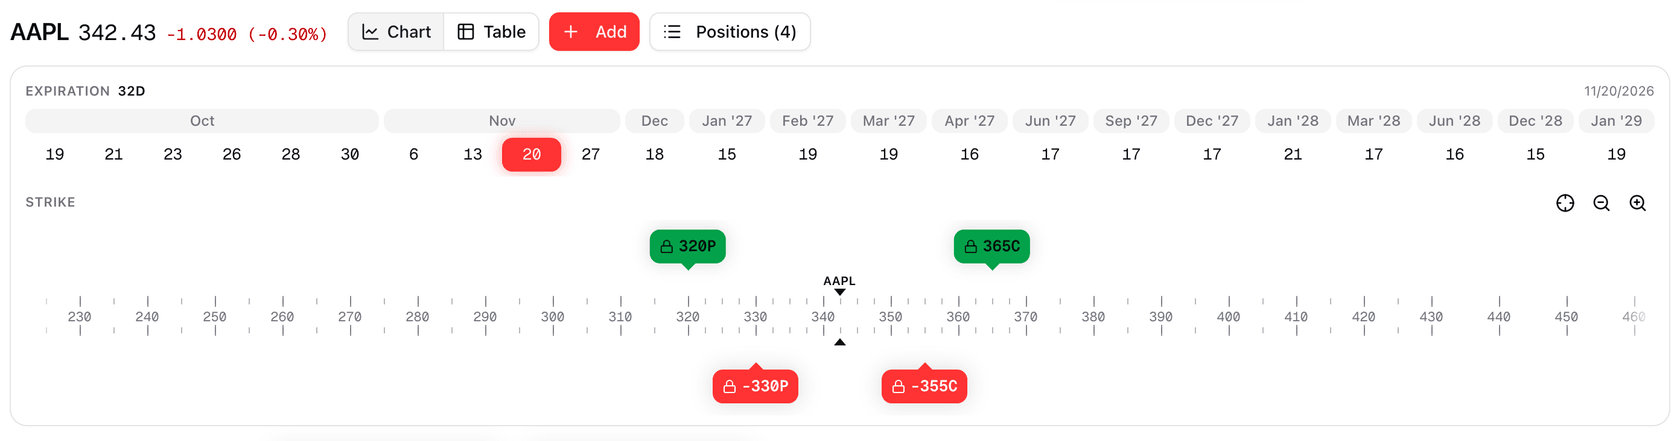
The strip groups the expirations by month, with the active one highlighted and the days remaining next to EXPIRATION. Below it, the ruler: bought legs above the axis, sold legs below, the spot marked by two triangles.
The strip lists every expiration of the symbol, grouped by month. Clicking a day moves all the legs on the expiration you are looking at to the new one — the natural move for a single-expiration strategy. Each leg keeps the nearest strike available there and is repriced from the new chain.
The ruler shows the strikes of that expiration, with the spot marked by two triangles and the symbol name. Every leg is a pill:
- green if bought, above the axis; red if sold, below it;
- labelled with strike and type —
365C,-330P,2× 90Cfor a quantity of two; - legs on another expiration are dimmed; clicking one takes the strip to its expiration.
To move a leg, drag its pill: it snaps to the strikes of its own expiration and the payoff is recalculated each time it lands on a new strike. With a pill selected, the left and right arrow keys move it one strike at a time. Zoom in, Zoom out and Center on spot sit next to the STRIKE label.
A small warning triangle on a pill means the bid-ask spread of that contract is wide: the price you actually get may differ from the mid.
A leg on the underlying — shares, or the future on a futures symbol — does not sit on the ruler: it appears in a Stock or Future row above the strip, for example Long 1 ESZ2026 at 7742.25, and a click opens its details.
The leg details
Section titled “The leg details”A click on a pill opens the details of that leg.
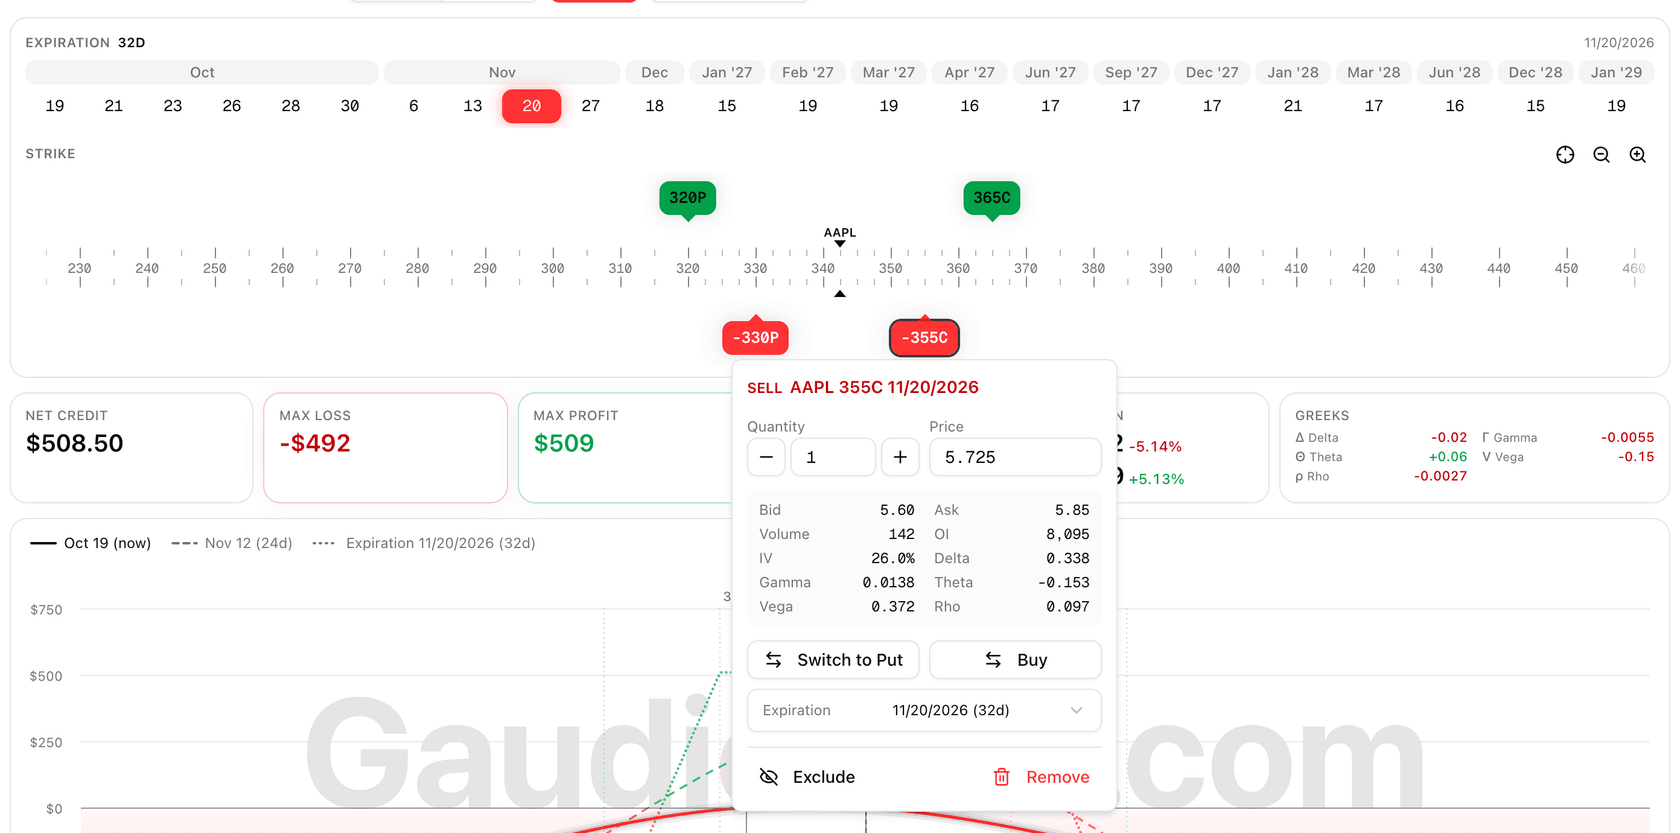
The details of a leg: quantity, editable price, bid and ask, volume, open interest, IV and the greeks, then the actions.
- Quantity, with − and + buttons.
- Price — the entry price. It starts from bid/ask or mid, following the Use: Bid/Ask — Mid Price switch in the header, and you can overwrite it.
- Bid, Ask, Volume, OI (open interest), IV, Delta, Gamma, Theta, Vega and Rho of the contract.
- Switch to Put / Switch to Call and Buy / Sell turn the leg around.
- Expiration moves this leg only to another expiration — the way to build a calendar or a diagonal.
- Exclude takes the leg out of the chart and the metrics without deleting it; Include puts it back.
- Remove deletes it.
On European EOD options (Eurex and IDEM) the price is the settlement, labelled as such, and no spread warning is shown: bid and ask both equal the settlement, so a zero spread says nothing about liquidity.
Adding legs
Section titled “Adding legs”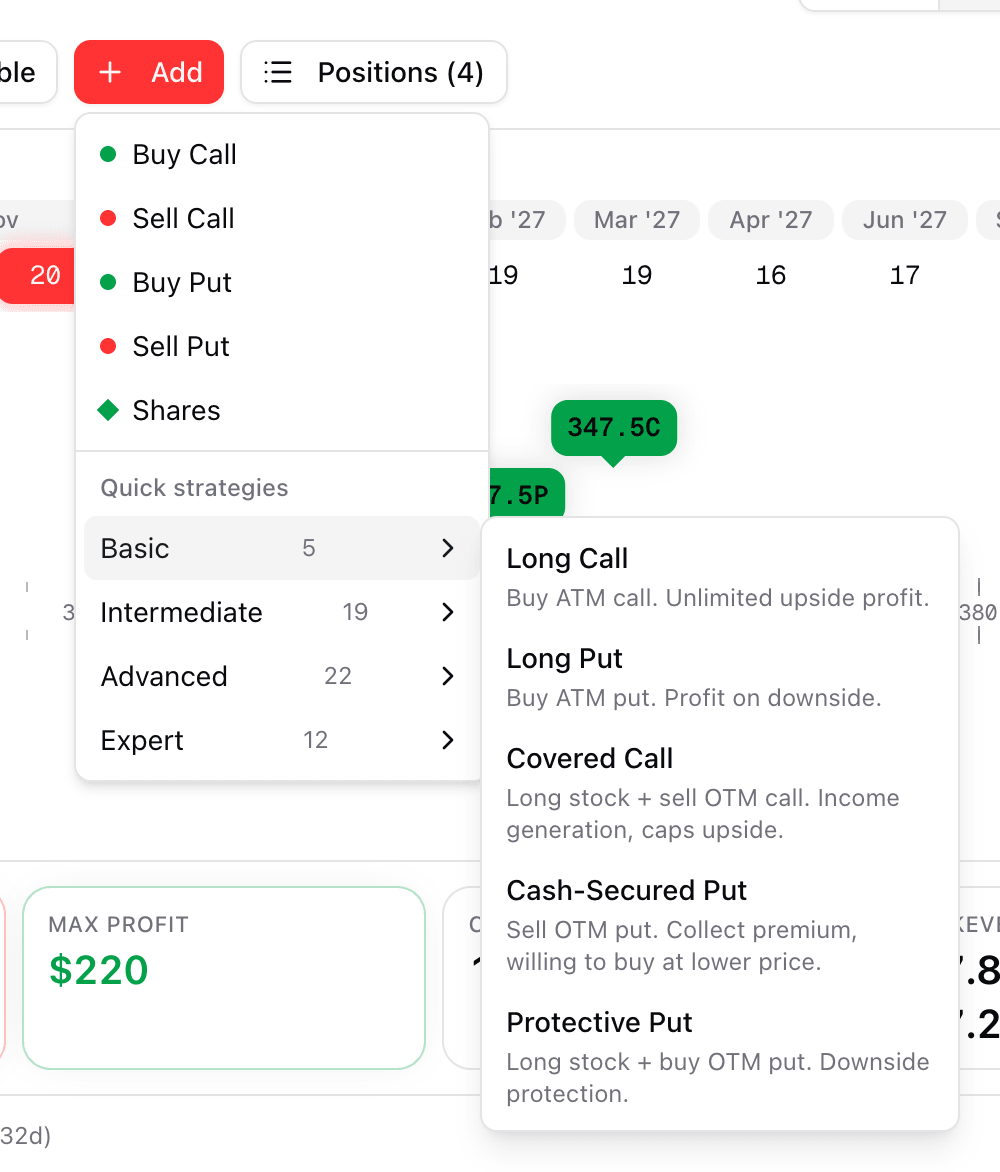
The Add menu: the four single legs, a leg on the underlying, and the quick strategies by level.
Add, next to the symbol, offers:
- Buy Call, Sell Call, Buy Put, Sell Put — a leg at the money on the expiration in view;
- Shares, or Future on a futures symbol — a leg on the underlying;
- Quick strategies — the same four levels as the gallery, Basic, Intermediate, Advanced and Expert, with the count of each.
A quick strategy picked from this menu replaces the legs in the builder: it is a new starting point, not an addition. For that reason the menu offers quick strategies only while the strategy has no saved legs.
The metrics bar
Section titled “The metrics bar”
Net credit, max loss, max profit, chance of profit, the two breakevens with their distance from the spot, and the position greeks.
| Card | What it shows |
|---|---|
| Net debit / Net credit | What the options cost or bring in at entry. A leg on the underlying appears in a line underneath |
| Max loss / Max profit | The extremes of the payoff at expiration, or Unlimited |
| Chance of profit | The probability of closing in profit. The info icon next to it says at which expiration and with which IV it is calculated |
| Breakeven | Each breakeven price with its distance from the spot in percent |
| Greeks | Delta, Gamma, Theta, Vega and Rho of the whole position |
On a narrow screen the bar becomes a carousel, with arrows to move between the cards.
The payoff chart
Section titled “The payoff chart”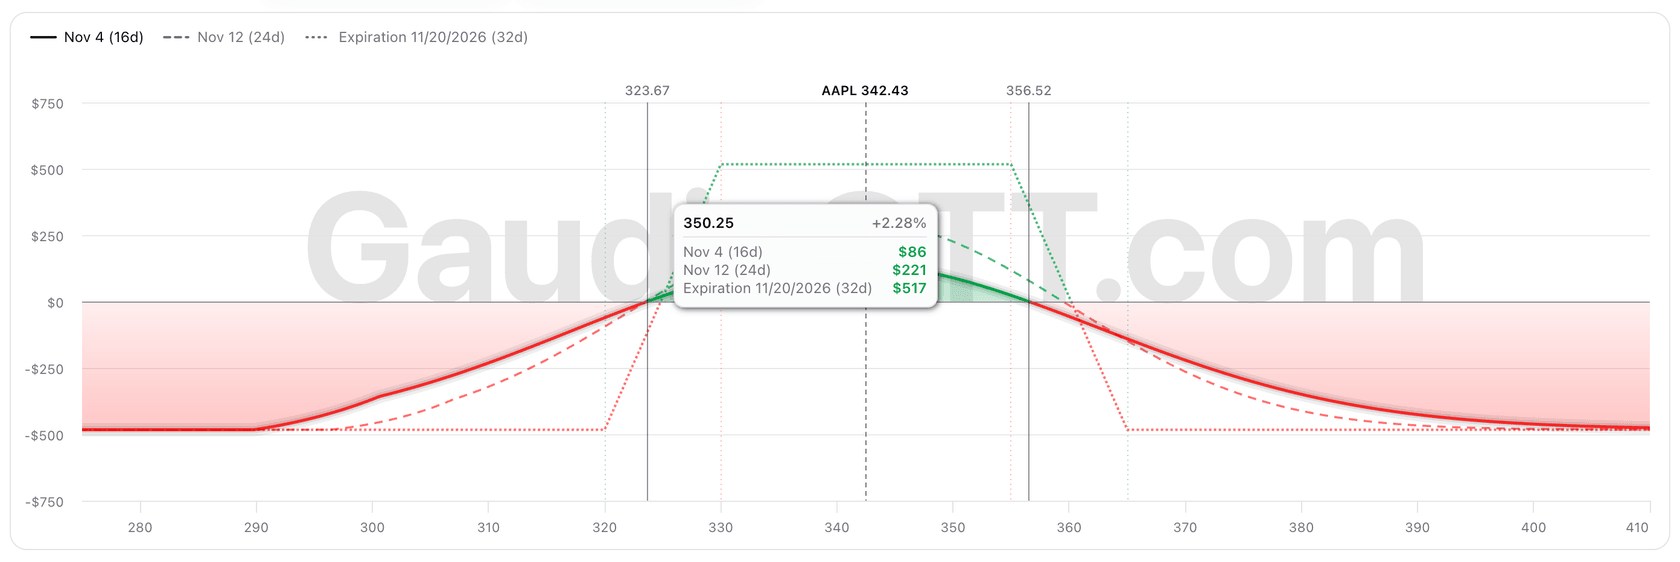
Three curves, the spot and the breakevens: the tooltip gives the P&L of each curve at the price under the mouse.
The chart draws three curves, named in the legend above it with their date and the days from now:
- solid, with the green and red area underneath: the P&L at the date of the Date slider. It starts at now;
- dashed: a fixed date between now and the expiration, as a reference for how the position ages;
- dotted: the P&L at expiration.
The vertical lines mark the spot and the breakevens of the solid curve, with their price at the top; they follow the Date slider. Hovering the chart shows the price, its distance from the spot and the P&L of each curve.
With a mouse, the wheel zooms around the price under the pointer and dragging moves the window sideways. On a trackpad, pinch to zoom and swipe with two fingers to move. Both write into the Range slider, so Reset there brings the automatic window back.
The sliders
Section titled “The sliders”
- Date — from Now to the first expiration; the solid curve and its breakevens follow it.
- Volatility — a multiplier from 0 to 3× of the implied volatility, with the resulting IV shown next to it.
- Range — how wide a price window the chart shows, as ± percent of the spot. Reset returns to the automatic window, which fits the strikes and the breakevens.
Excluding or including a leg brings date, volatility and zoom back to their starting values.
The P&L table
Section titled “The P&L table”The Chart | Table switch in the header replaces the chart with a table of profit and loss by underlying price and date.
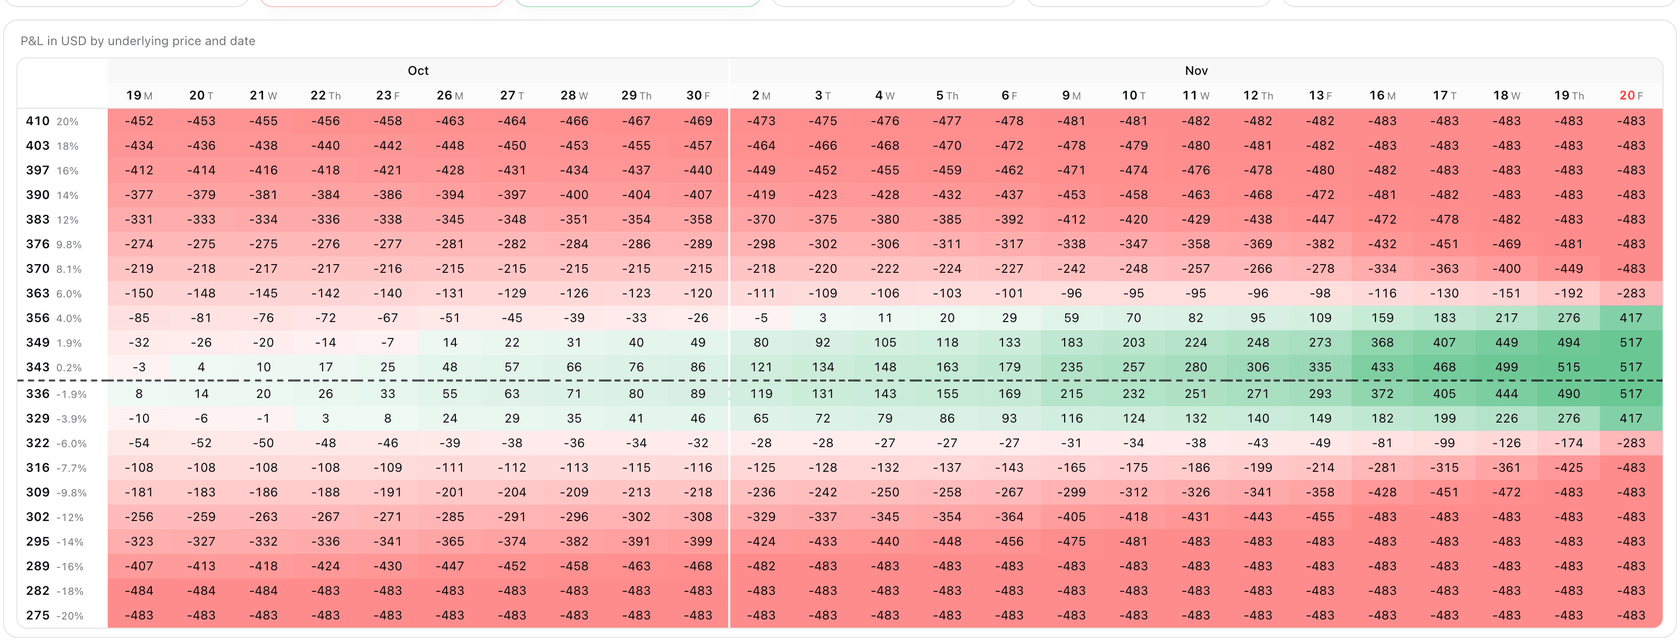
Rows are prices, columns are trading days up to the expiration. The colour of each cell grows with the size of the profit or the loss.
- Rows: 21 prices spread across the window of the Range slider, each with its distance from the spot. A dashed line marks where the spot falls.
- Columns: the trading days up to the first expiration, valued at the close; past 30 trading days, one column per week, and within the last day, one per hour.
- Cells: the P&L in the currency shown above the table, without decimals, green for a profit and red for a loss.
In table view the Date slider is hidden — every column is already a date — and Volatility and Range keep working. The builder always reopens on the chart.
The Positions panel
Section titled “The Positions panel”Positions (n) opens the list of every leg in a panel from the right.
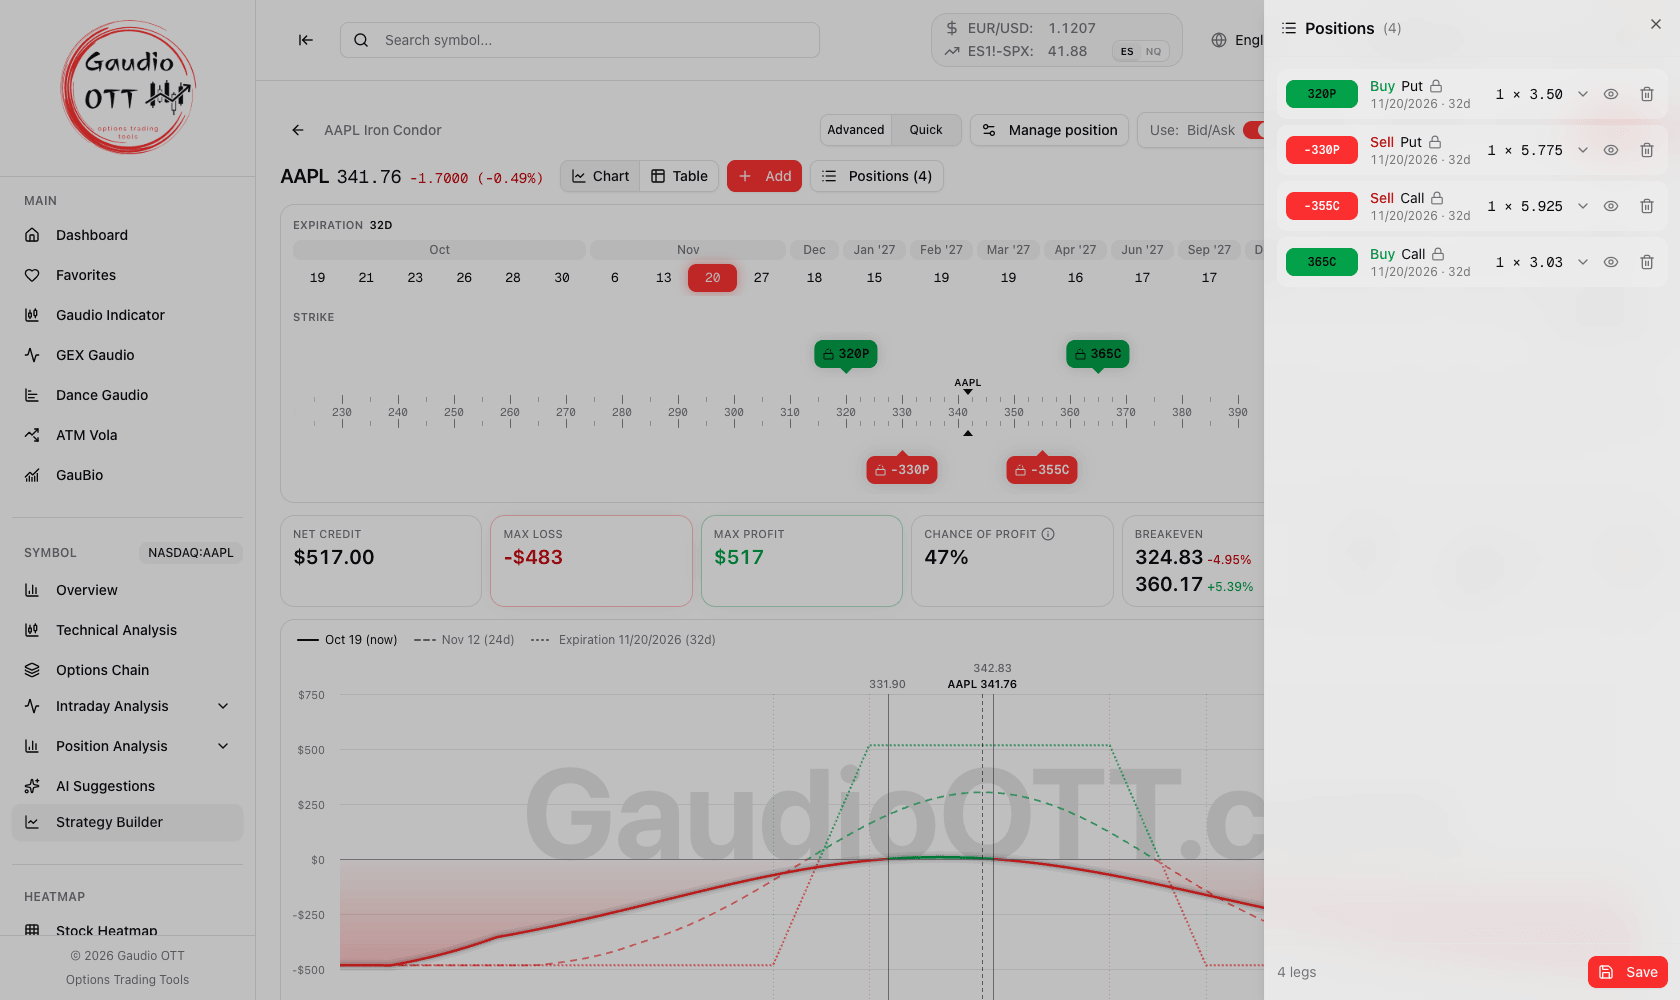
One row per leg: label, side and type, expiration with days remaining, quantity and entry price, with the exclude and remove buttons.
A click on a row opens its details underneath, as on the ruler. At the foot of the panel, the number of legs and Save. A click outside closes it.
Saving, reopening and exporting
Section titled “Saving, reopening and exporting”Save opens the same dialog as Advanced mode: name, notes, tags and costs. The strategy is saved in Quick mode, and its card in the list says so with a Quick label; View and the pencil both open it back in Quick mode.
On a saved strategy:
- the legs already saved carry a lock: they cannot be dragged, and their details are read-only;
- in place of Switch to Put, Buy/Sell and Expiration, the details of a saved leg offer Manage position, which opens the strategy in Advanced mode to close the leg, add to it or correct its history;
- new legs can be added and moved freely, and become locked once saved;
- removing a saved leg asks for confirmation;
- Save stays on the page, and Export downloads the strategy as a file, the same one Advanced mode imports.
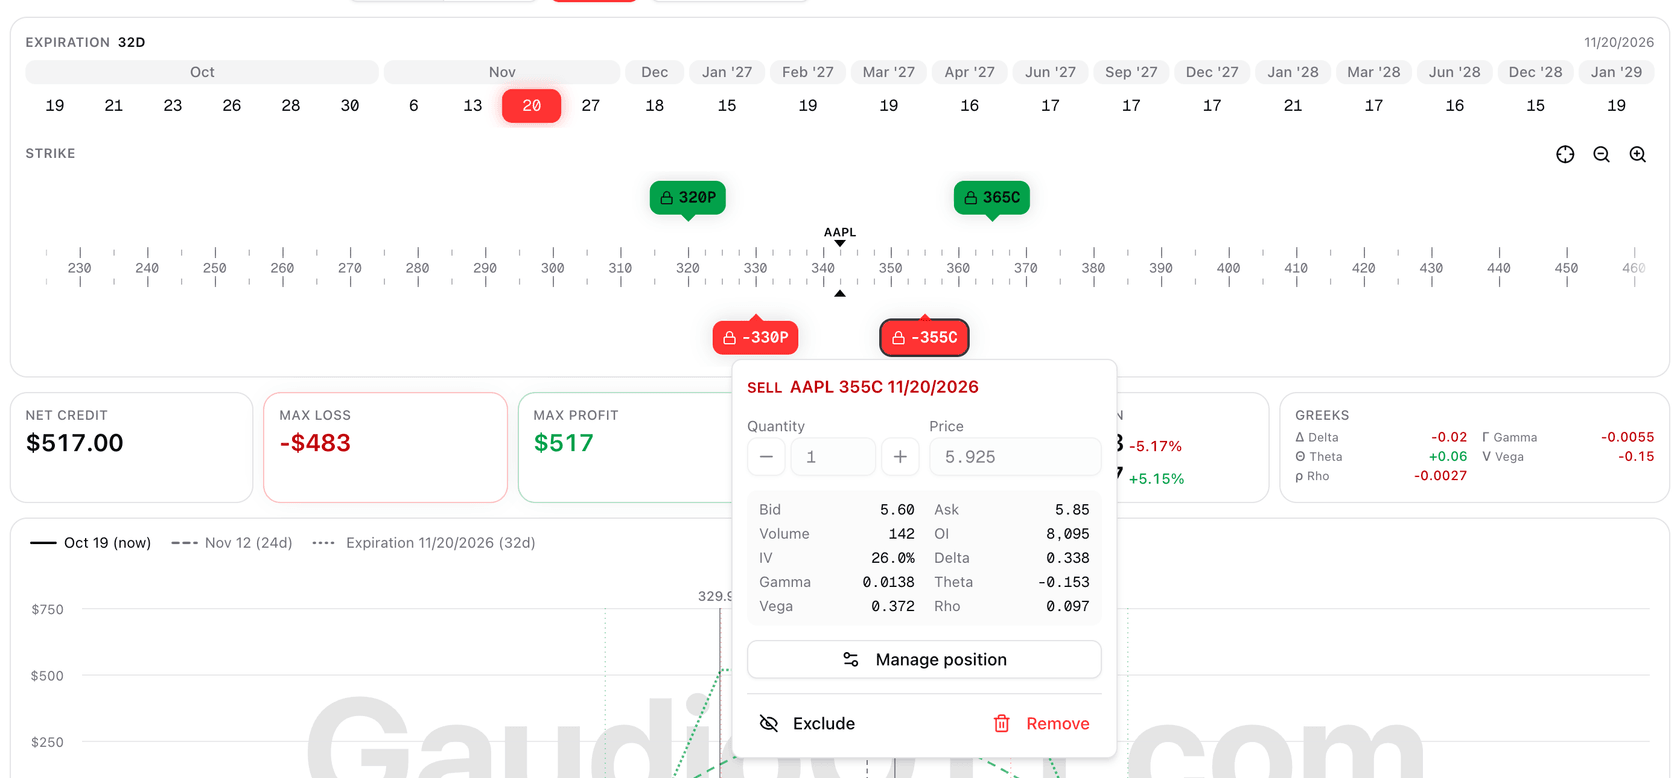
A saved strategy: the saved legs carry a lock, their details are read-only, and Manage position takes you to Advanced mode.
When a leg has expired, a notice says so, with a button to Advanced mode to confirm how it ended — as described in Monitoring and closing.
On a phone
Section titled “On a phone”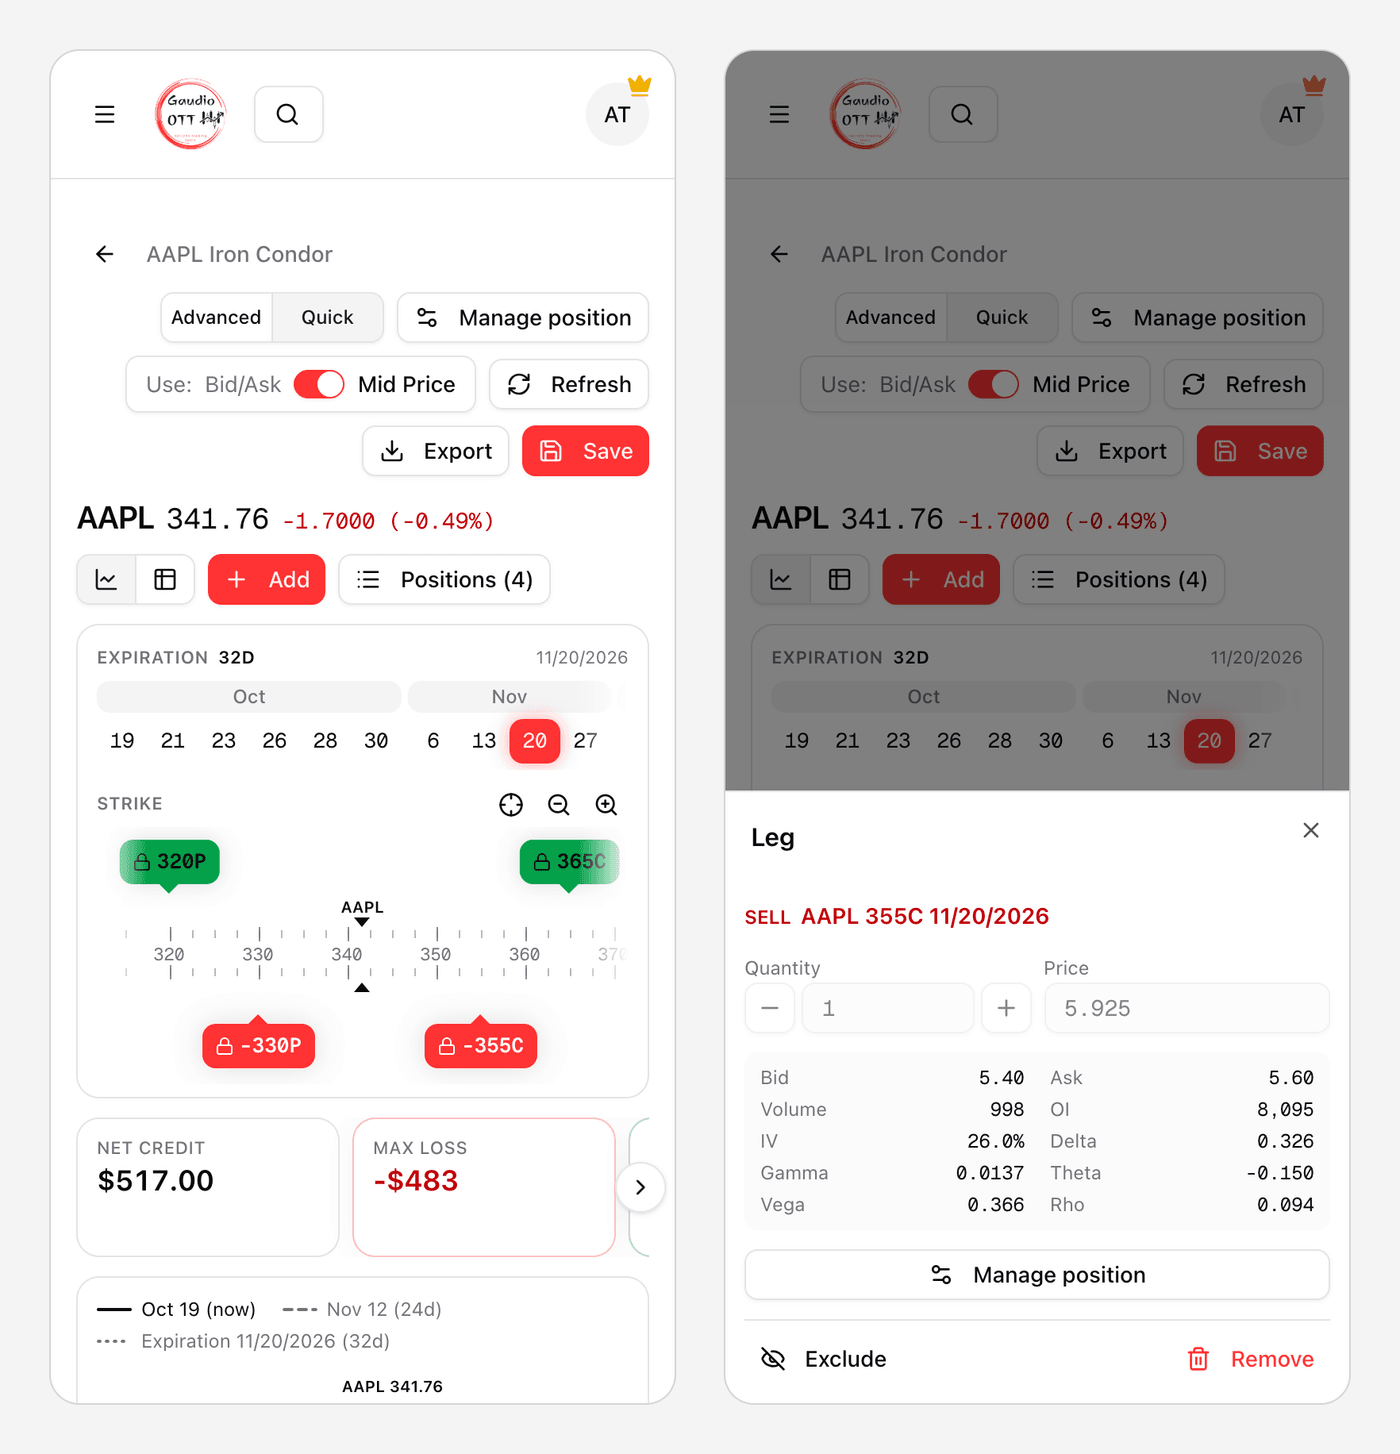
On a phone: on the left the builder, with the metrics bar as a carousel; on the right the details of a leg, in a panel from the bottom of the screen.
- The details of a leg open in a panel from the bottom, and so they do on a phone held sideways.
- With a leg selected, scrolling the ruler moves the strike under a fixed marker, so you do not have to hit a small pill with a finger. Center on spot and the X leave without moving the leg.
- The metrics bar is a carousel; on the chart, a finger scrolls the page rather than zooming.
Common mistakes
Section titled “Common mistakes”- Expecting a click on the strip to move one leg. It moves every leg on the expiration in view. For a calendar or a diagonal use Expiration in the details of the leg you want to move.
- Reading the dashed curve as the date of the slider. The solid curve follows the Date slider; the dashed one is a fixed reference date.
- Looking for close leg or trade history in Quick mode. Position management stays in Advanced mode: Manage position takes you there with the same strategy.
- Reloading the page before saving. A new strategy that has not been saved is lost on reload, as in Advanced mode.
- Trusting the mid on a leg with the warning triangle. A wide spread means the fill can be far from the mid price: use Bid/Ask, or enter the price you expect.
Frequently asked questions
What is Quick mode in the Gaudio OTT Strategy Builder?
It is a second interface for building options strategies: you pick the expiration on a strip, drag the legs along a strike ruler and see the payoff, the metrics and a P&L table update as you move them. It uses the same data and the same calculations as Advanced mode, which keeps the full options chain.
How do I start a strategy in Quick mode?
Open the Strategy Builder from the side menu, click New Strategy, choose Quick in the window that asks how you want to build the strategy, and click Start. Pick the expiration on the strip, then a strategy from the gallery or single legs from Add, adjust the strikes on the ruler and click Save.
Do Quick and Advanced mode give the same numbers?
Yes. They share the prices, the payoff and the metrics calculations, so the same strategy shows the same net cost, maximum profit and loss, breakevens and greeks in both modes.
Can I switch from Quick to Advanced mode in the middle of a strategy?
Yes. The Advanced | Quick switch at the top of the builder moves to the other mode at any time. An unsaved strategy keeps its legs; a saved one reopens in the other mode and from then on opens there.
Which predefined strategies are available in Quick mode?
The same 58 as Advanced mode, in four levels: Basic, Intermediate, Advanced and Expert. In Quick mode they are also shown as a gallery with a drawing of each payoff and filters by outlook: bullish, bearish, neutral and volatile.
How do I build a calendar or a diagonal spread in Quick mode?
Pick the Calendar or Diagonal quick strategy, or open the details of a leg and use Expiration to move that single leg to another expiration. A click on the expiration strip instead moves every leg on the expiration in view.
What does the P&L table show?
The profit and loss of the strategy for 21 underlying prices across the chart window and for each trading day up to the first expiration, with cells coloured from red to green in proportion to the result.
Can I close a leg in Quick mode?
No. Closing legs, adding to a position and the trade history stay in Advanced mode. On a saved strategy, Manage position opens it there.
Does Quick mode work on futures and European options?
Yes: US options, futures with the future leg valued at its point value, and Eurex and IDEM options with their end-of-day settlement prices.
Related pages
Section titled “Related pages”- Strategy Builder overview
- Legs and quick strategies
- Payoff chart and simulation
- Monitoring and closing
- Opportunities Scanner
Ready to use Gaudio OTT?
Section titled “Ready to use Gaudio OTT?”Open your free account and put what you just read into practice.