
Vecta Gaudio
Vecta Gaudio shows, strike by strike, whether market makers are long or short gamma on today’s SPX options, calculated from the trades of the session. A green bar is a strike where their hedging works against the move and slows price down; a red bar is one where it works with the move and speeds price up.
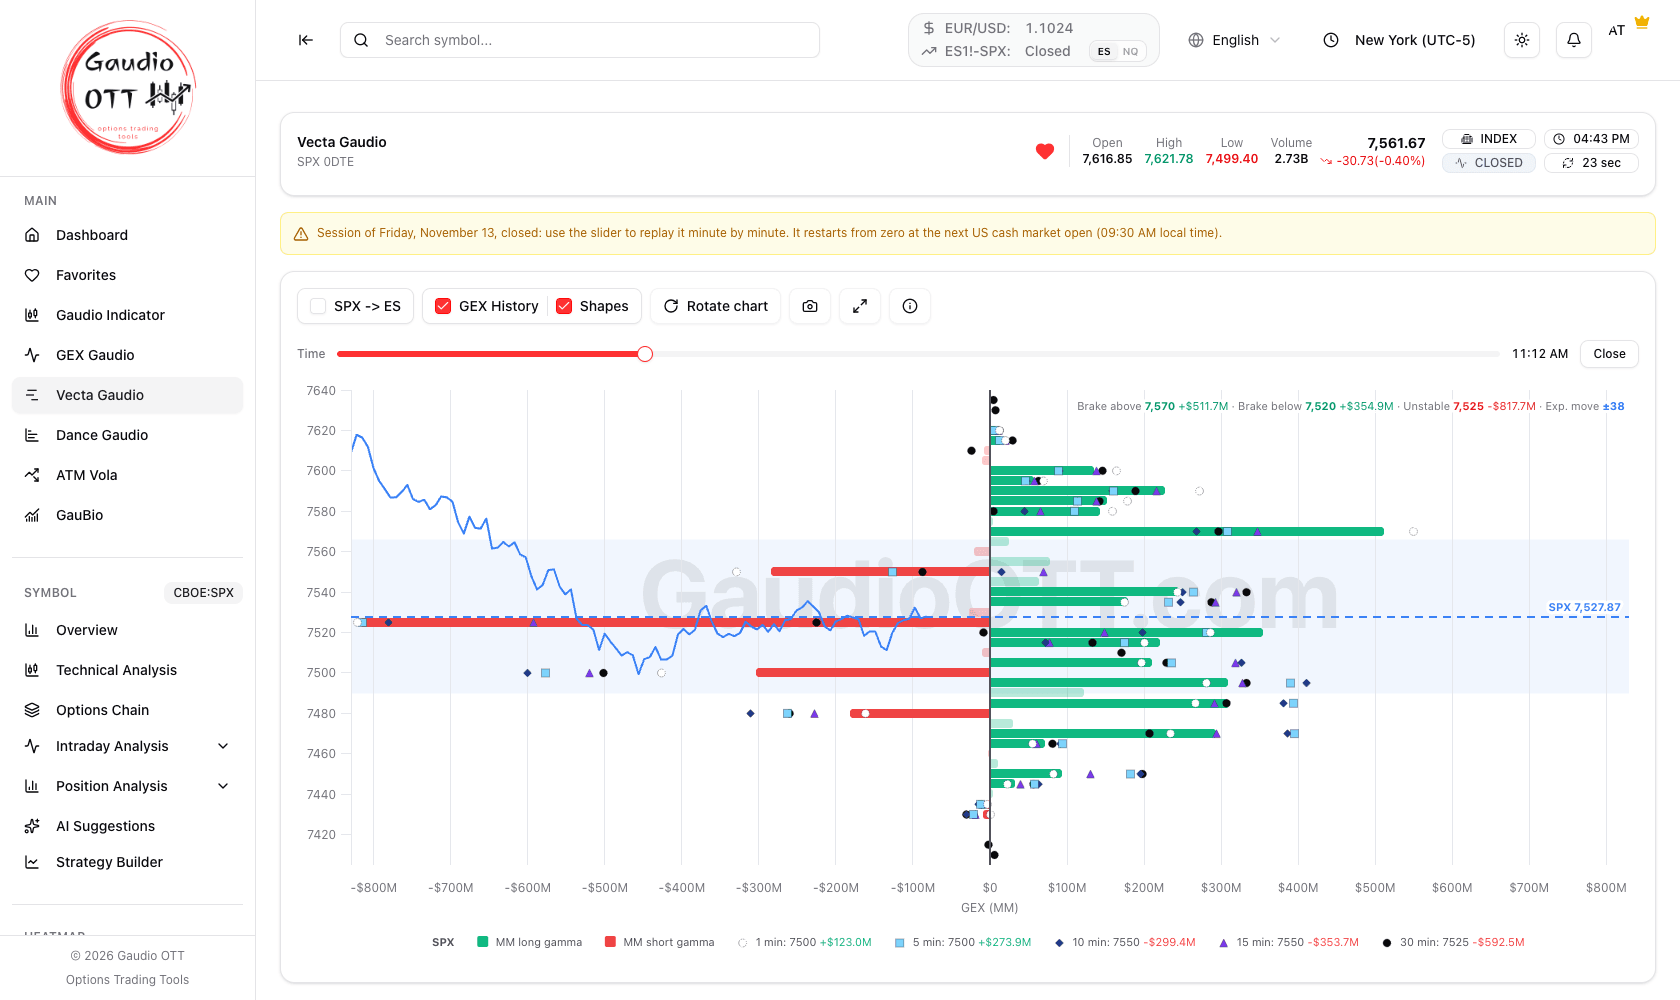
Vecta Gaudio on a closed session, replayed at 11:12 New York: green bars where market makers are long gamma, red bars where they are short, the SPX price on the left and the key levels line at the top right.
What it is for
Section titled “What it is for”The standard gamma exposure profile, the one of GEX Gaudio, starts from a fixed assumption about who holds calls and who holds puts. Vecta Gaudio drops that assumption: it looks at the SPX 0DTE trades of the session and calculates, on each strike, which side the market makers ended up on. The result is a map of where their hedging brakes the market and where it accelerates it, today, on the options that expire today.
- Green near price is a brake. Above price it tends to act as resistance, below price as support: the market maker sells into rises and buys into falls.
- Red near price is an unstable zone. If price gets there, the move tends to extend instead of stopping: the market maker buys into rises and sells into falls.
- Bars far from price matter little until price gets close to them.
- It restarts from zero every session. It counts only today’s trades on options that expire today, so the picture builds up through the morning.
It is not a trading signal: it tells you what kind of ground price is moving on, and it is read together with GEX Gaudio and Dance Gaudio.
Where it is
Section titled “Where it is”Side menu, Main → Vecta Gaudio. Available on the Ultra plan only.
What the page shows
Section titled “What the page shows”The page works on SPX options expiring today (0DTE), from the 09:30 New York open to the close. While the market is open it updates on its own every minute, and the header shows the SPX price with the countdown to the next update.
Below the header you find the controls and one chart:
- The bars, one per strike, every 5 points, around the current price. The line in the middle is zero: green bars on the right are strikes where market makers are long gamma (MM long gamma in the legend), red bars on the left are strikes where they are short gamma (MM short gamma).
- The length of a bar is its GEX: by how many dollars the market maker’s hedge changes when SPX moves 1%. The longer the bar, the more futures they have to buy or sell on every move, and the more that strike weighs on price.
- The price line on the left half of the chart is the SPX price of the session up to the minute shown, on the same price scale as the strikes, so you see at a glance which bars price has crossed and which it is heading towards.
- The dashed blue line is the current price, and the light blue band around it is the expected move from now to the close: the bars inside the band are the ones price can still reasonably reach today.
- Faded bars are strikes whose figure is not clear-cut enough yet: they stay where they are, in a lighter shade, but their colour is less reliable. They become solid again as soon as the picture firms up.
- The dots on the bars are the history, explained below.
The bars are not comparable with those of GEX Gaudio. On GEX Gaudio the colour tells calls from puts; on Vecta Gaudio it tells whether the market maker is long or short gamma, so a put can be a green bar and a call a red one.
The key levels line
Section titled “The key levels line”At the top right of the chart a line sums up what the guide teaches you to look for:
- Brake above — the largest green bar at or above price, with its GEX: the nearest thing to a resistance.
- Brake below — the largest green bar below price: the nearest thing to a support.
- Unstable — the largest red bar, on either side of price.
- Exp. move — the expected move to the close, in SPX points.
Only solid bars count: a faded bar is never picked as a level. On a phone the line shows the strikes without the amounts, which stay in the tooltip.
Reading a bar: the tooltip
Section titled “Reading a bar: the tooltip”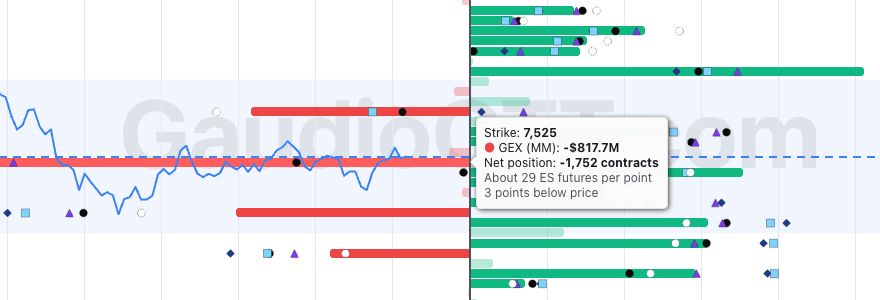
The tooltip of the largest red bar: about 29 ES futures per SPX point, 3 points below price.
Hovering a bar shows:
- Strike and GEX (MM), the value of the bar.
- Net position — the market makers’ net position on that strike, in contracts, calls and puts together.
- About N ES futures per point — how many ES futures their hedge moves for every SPX point. It makes the size of the bar concrete: a red bar of -$730M at 7525 is about 26 ES futures per point, all in the direction of the move.
- How far it is from price, in points above or below, or At price.
The history dots
Section titled “The history dots”With GEX History on (it is by default) the bars carry dots: they are the value that same bar had 1, 5, 10, 15 and 30 minutes earlier, with the colours and shapes of GEX Gaudio: 1 minute a near-white circle, 5 a light blue square, 10 a dark blue diamond, 15 a purple triangle, 30 a black circle. Turn off Shapes if you prefer plain dots of the same colours. Hovering a dot shows the strike, the interval and the value.
- Bar beyond its dots: that strike is growing.
- Dots beyond the bar: it is losing weight.
- Dots on the other side of zero: the strike has changed colour in the meantime.
- A dot on a strike without a solid bar marks a bar that was there and has faded or gone: you still see where it was.
The legend gives, for each interval, the strike that changed the most and by how much, green if it grew and red if it fell. During the session the dots appear one interval at a time: next to GEX History a counter such as 2/5 says how many intervals have passed since the open.
Controls
Section titled “Controls”
The controls, and on a closed session the Time slider to replay it.
- SPX → ES — moves strikes, bars, dots and price onto the ES future, as on GEX Gaudio, and the chart reads ES. Offset lets you choose between Auto and a value of your own. While the market is open Auto is the current ES − SPX spread; on a closed session it is the spread of the last minute of that session, so the bars stay on the ES price line.
- GEX History and Shapes — show or hide the dots, and their shapes.
- Rotate chart — swaps the axes: strikes run horizontally and the green bars point up. On a phone the chart always keeps the strikes vertical.
- Reset Zoom — appears once you have zoomed in.
- Save chart (the camera) — downloads the chart as an image. Fullscreen opens it on the whole screen; Esc closes it.
- How to read the bars (the i icon) — the guide to the chart, inside the page.
- Time — on a closed session, a slider moves the chart to any minute of the session; Close brings it back to the last minute. Only the latest session can be replayed.
The page remembers SPX → ES, the offset, GEX History and Shapes.
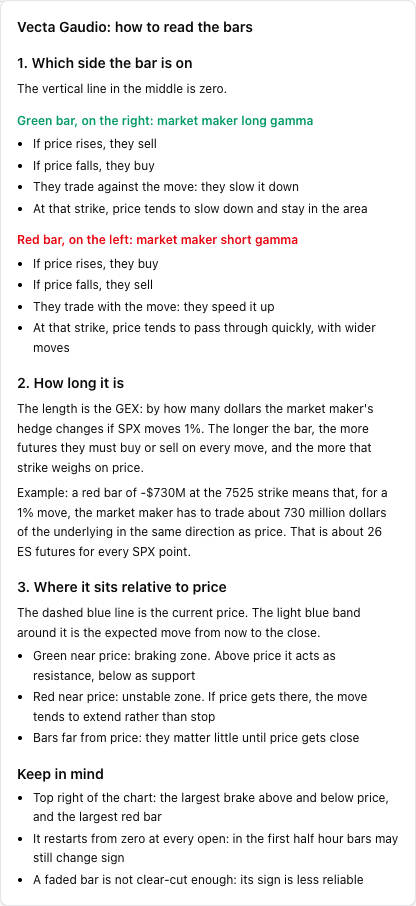
The guide behind the i icon: which side the bar is on, how long it is, where it sits relative to price.
Use the mouse wheel over the chart to zoom the strikes, then drag with the left button held down to move around. On touch devices, pinch to zoom and move with two fingers. Reset Zoom goes back to the full view.
The first half hour, and before the open
Section titled “The first half hour, and before the open”The picture starts from zero at the open. In the first half hour, while the trades are still few, a Data building up badge reminds you that bars can still change colour: give them time before relying on them.
Before the open and after the close the page shows the last session, with a notice that gives its date and when the next one starts, in your time zone. With the Time slider you can replay it minute by minute.
How to use it
Section titled “How to use it”- At a glance: read the key levels line. The brake above and the brake below frame the area where hedging tends to hold price; the unstable strike is where a move can extend.
- Inside the expected move: give more weight to the bars inside the light blue band, the ones price can still reach today.
- Green around price: a session where price tends to stay in the area. Red around price: a session where moves can run further than usual, and levels give way more easily.
- Watch the dots on the bars nearest to price: a brake that is growing is more reliable than one that is fading.
- With GEX Gaudio: GEX Gaudio gives the classic gamma picture with the market maker levels, Vecta Gaudio says which side market makers actually ended up on today. When the two agree, the level carries more weight.
- With Dance Gaudio: Dance Gaudio shows where the volume is going now; Vecta Gaudio shows what that volume has left behind in the market makers’ book.
- If you trade ES, turn SPX → ES on before writing the levels down.
Common mistakes
Section titled “Common mistakes”- Reading the colours as calls and puts. On Vecta Gaudio green means market makers long gamma and red short gamma, whatever the option type.
- Treating it as the market makers’ published book. It is calculated from the session’s trades: it is a reading of the flow, not a disclosure of positions.
- Trusting faded bars, or the first half hour. Faded bars and the bars of the first minutes can still change colour.
- Giving a far bar the weight of a near one. Bars far from price, and outside the expected move, count little until price gets close.
- Carrying the levels to the next day. The options of a session expire that day: the next session starts again from zero.
- Expecting other symbols or expirations. Vecta Gaudio covers SPX options expiring today only.
Frequently asked questions
What does Vecta Gaudio show in Gaudio OTT?
The gamma (GEX) of market makers on SPX options expiring today, strike by strike, calculated from the trades of the session. Green bars are strikes where market makers are long gamma and their hedging slows price down; red bars are strikes where they are short gamma and their hedging speeds price up.
How is Vecta Gaudio different from GEX Gaudio?
GEX Gaudio shows the classic gamma profile, where colour separates calls from puts. Vecta Gaudio calculates from the session trades whether market makers are long or short gamma on each strike, so colour means long or short gamma: a put can be a green bar. The two are read together.
What do the green and red bars mean?
Green: market makers long gamma. They sell when price rises and buy when it falls, so price tends to slow down and stay in the area. Red: market makers short gamma. They buy when price rises and sell when it falls, so moves tend to extend.
What are Brake above, Brake below and Unstable?
The key levels line at the top right of the chart: the largest green bar above price, the largest green bar below price and the largest red bar, with the expected move to the close. Only solid bars are considered.
Why are some bars faded?
Their figure is not clear-cut enough yet, so their colour is less reliable. They stay on the chart in a lighter shade and become solid again when the picture firms up.
Why does Vecta Gaudio start from zero every day?
It counts only the trades of the session on options expiring that day. In the first half hour a Data building up badge reminds you that bars can still change colour.
Can I review a past session?
The latest session, yes: when the market is closed the Time slider moves the chart to any minute of it, and Close brings it back to the end. Older sessions cannot be selected.
Can I see the levels on the ES future?
Yes. Turn on SPX → ES: strikes, bars, dots and price move onto ES with an automatic offset, or one you set yourself.
Which plans include Vecta Gaudio?
Ultra only.
Related pages
Section titled “Related pages”Ready to use Gaudio OTT?
Section titled “Ready to use Gaudio OTT?”Open your free account and put what you just read into practice.